
¡hola!
I’m diana estefanía rubio
Designer specialized in data visualization, with over 15 years of experience transforming complex narratives into compelling visual stories.
My work is guided by editorial rigor, emotionally resonant design, and a deep respect for both the data and the human stories it represents.
— I describe my work as artisan data visualization...
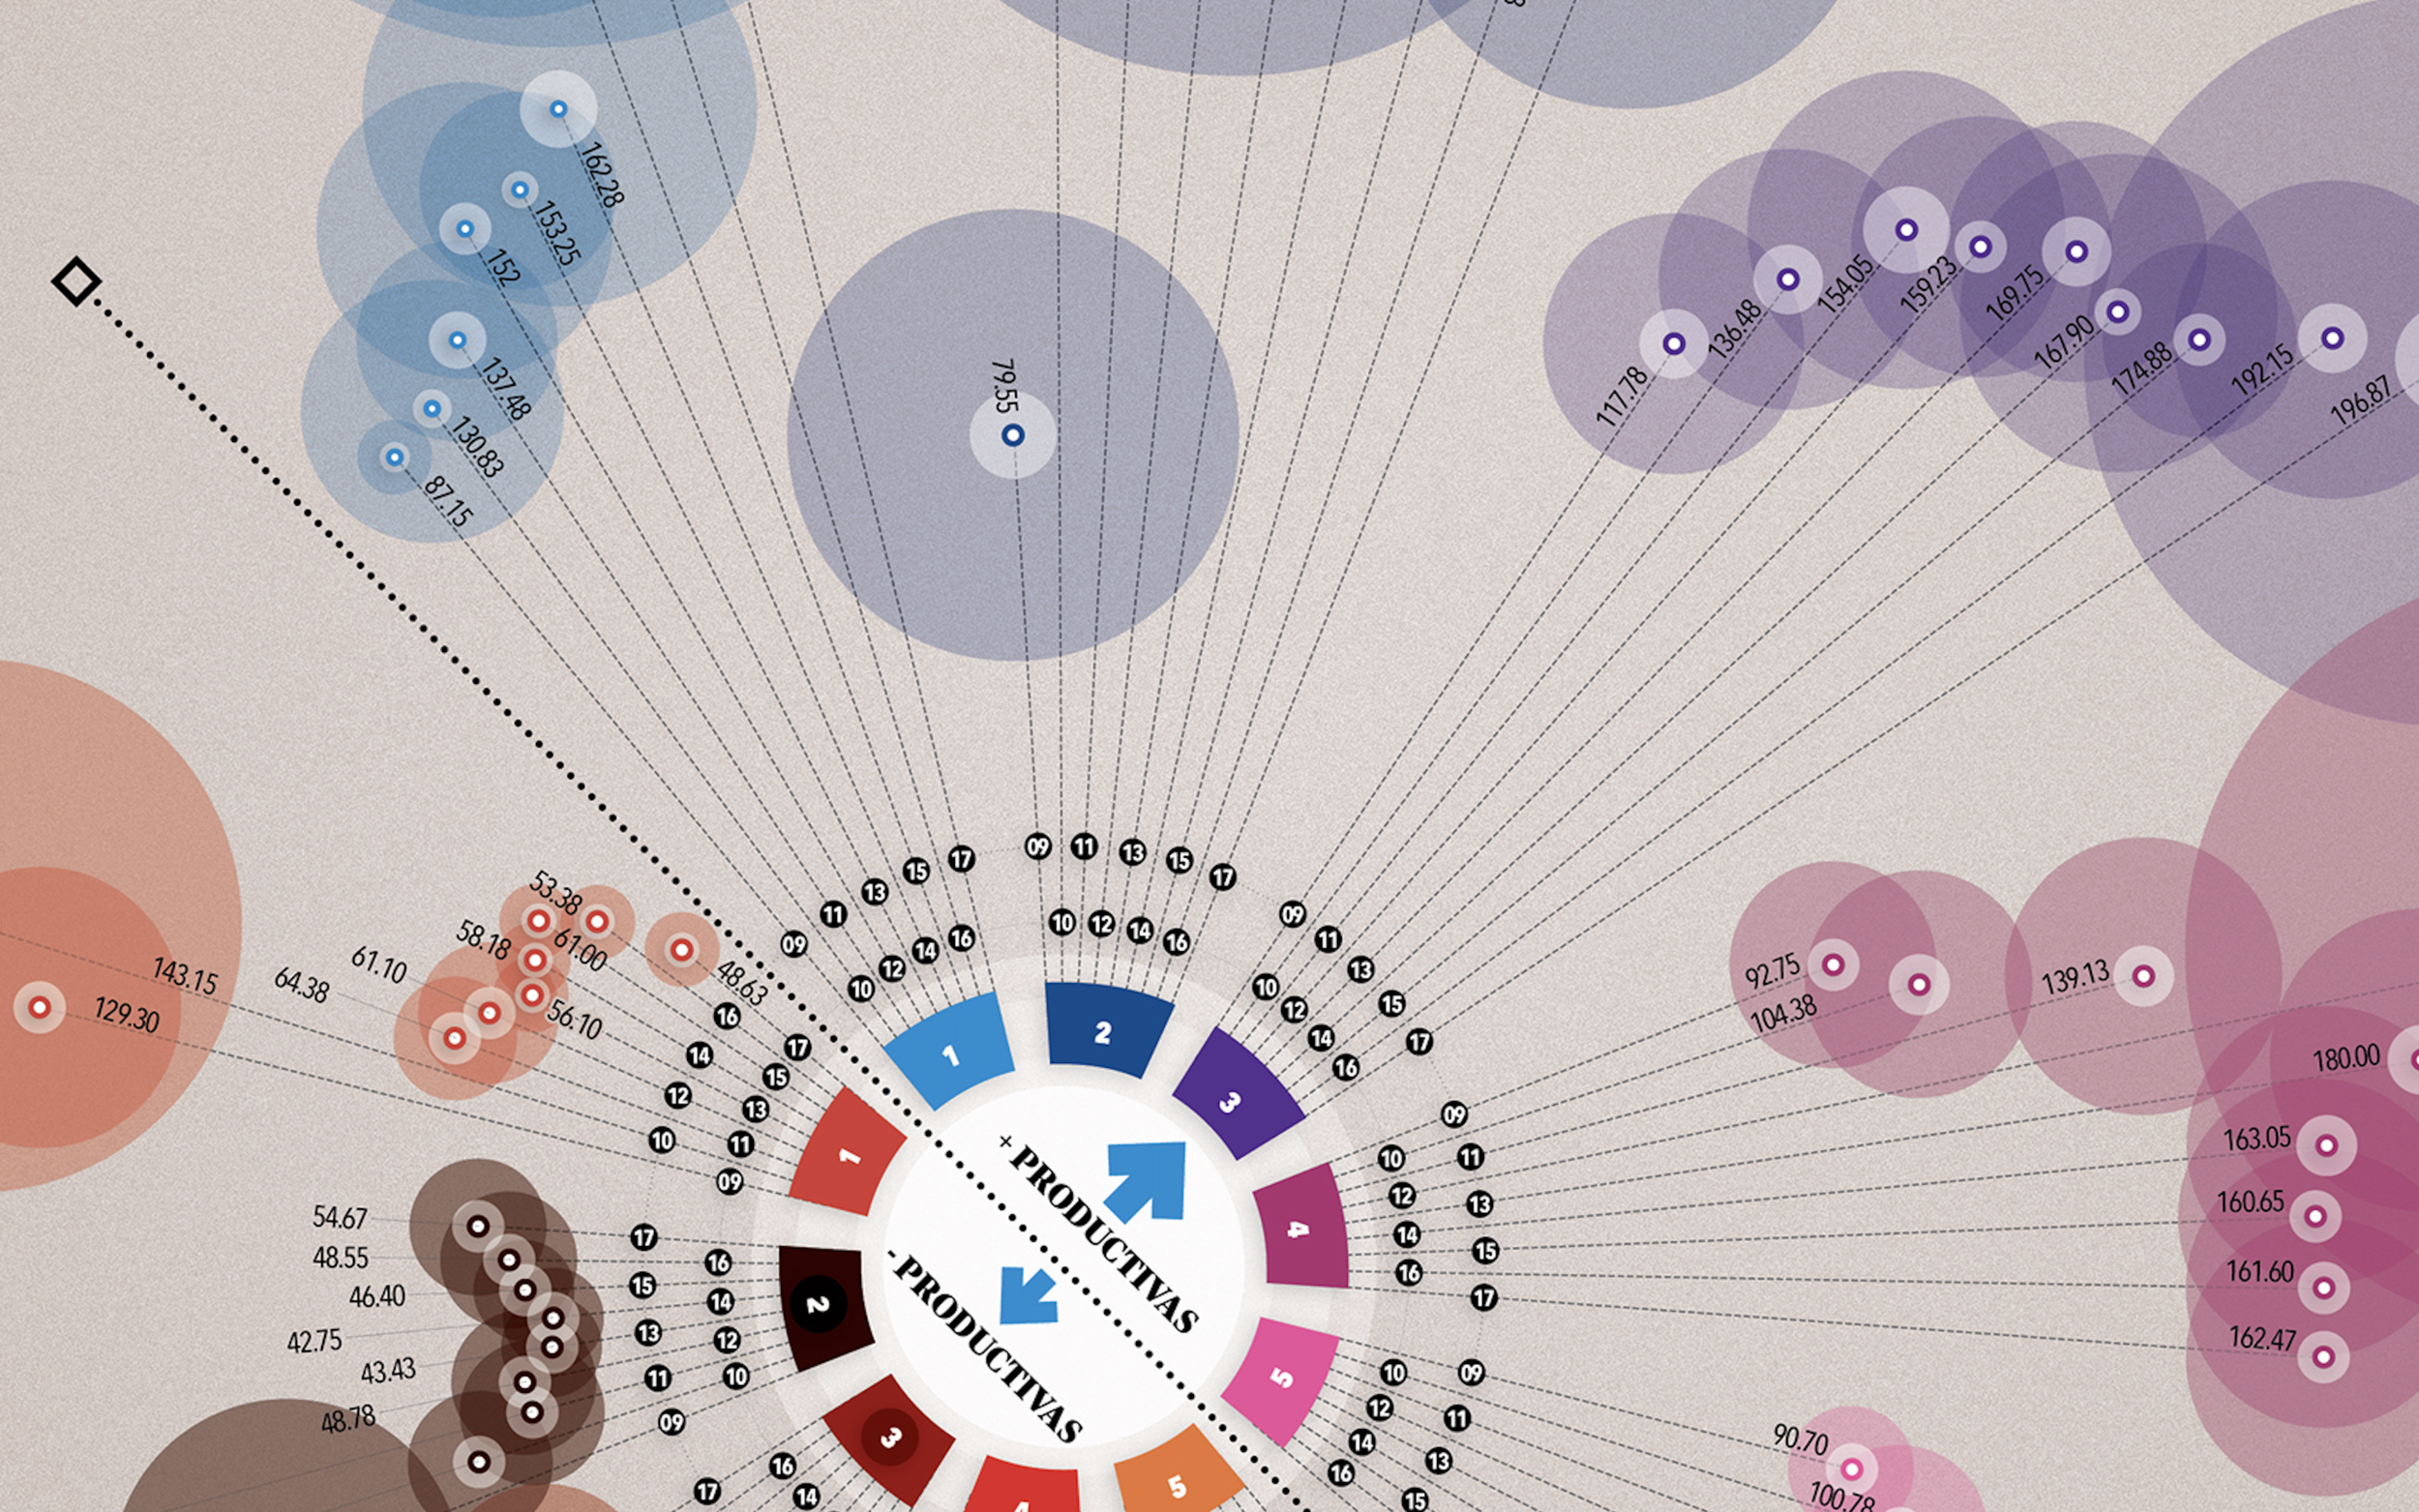
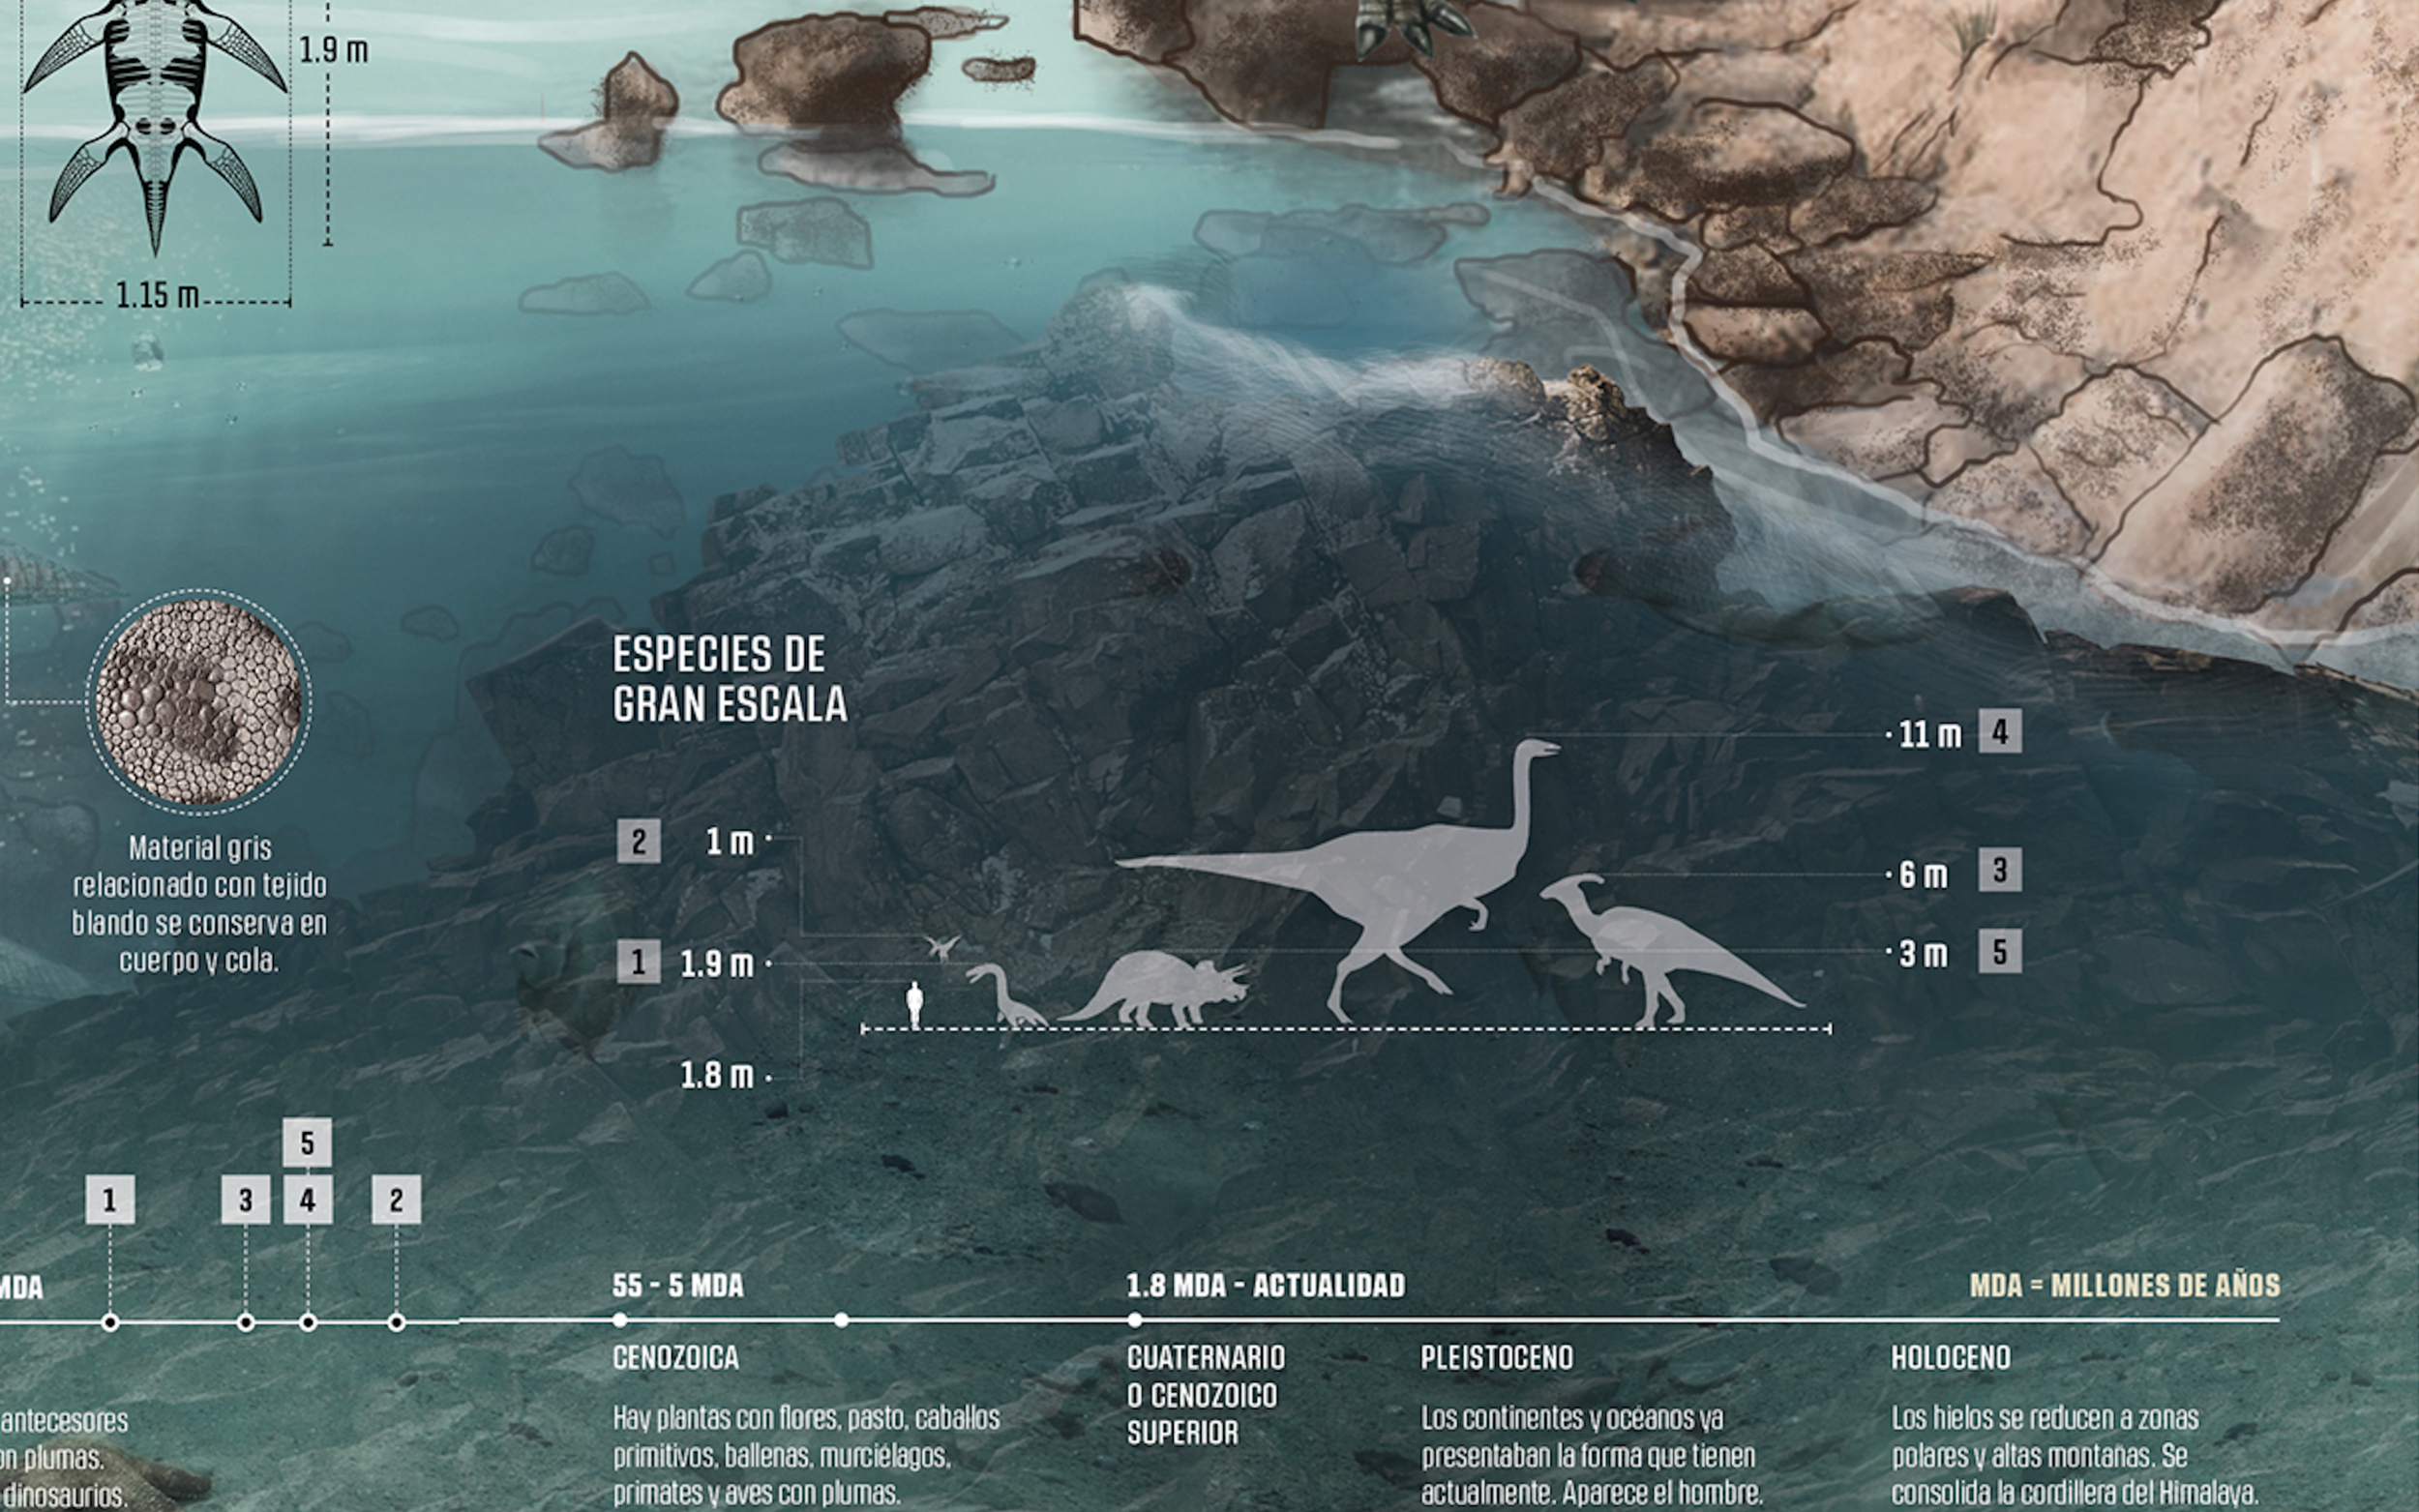
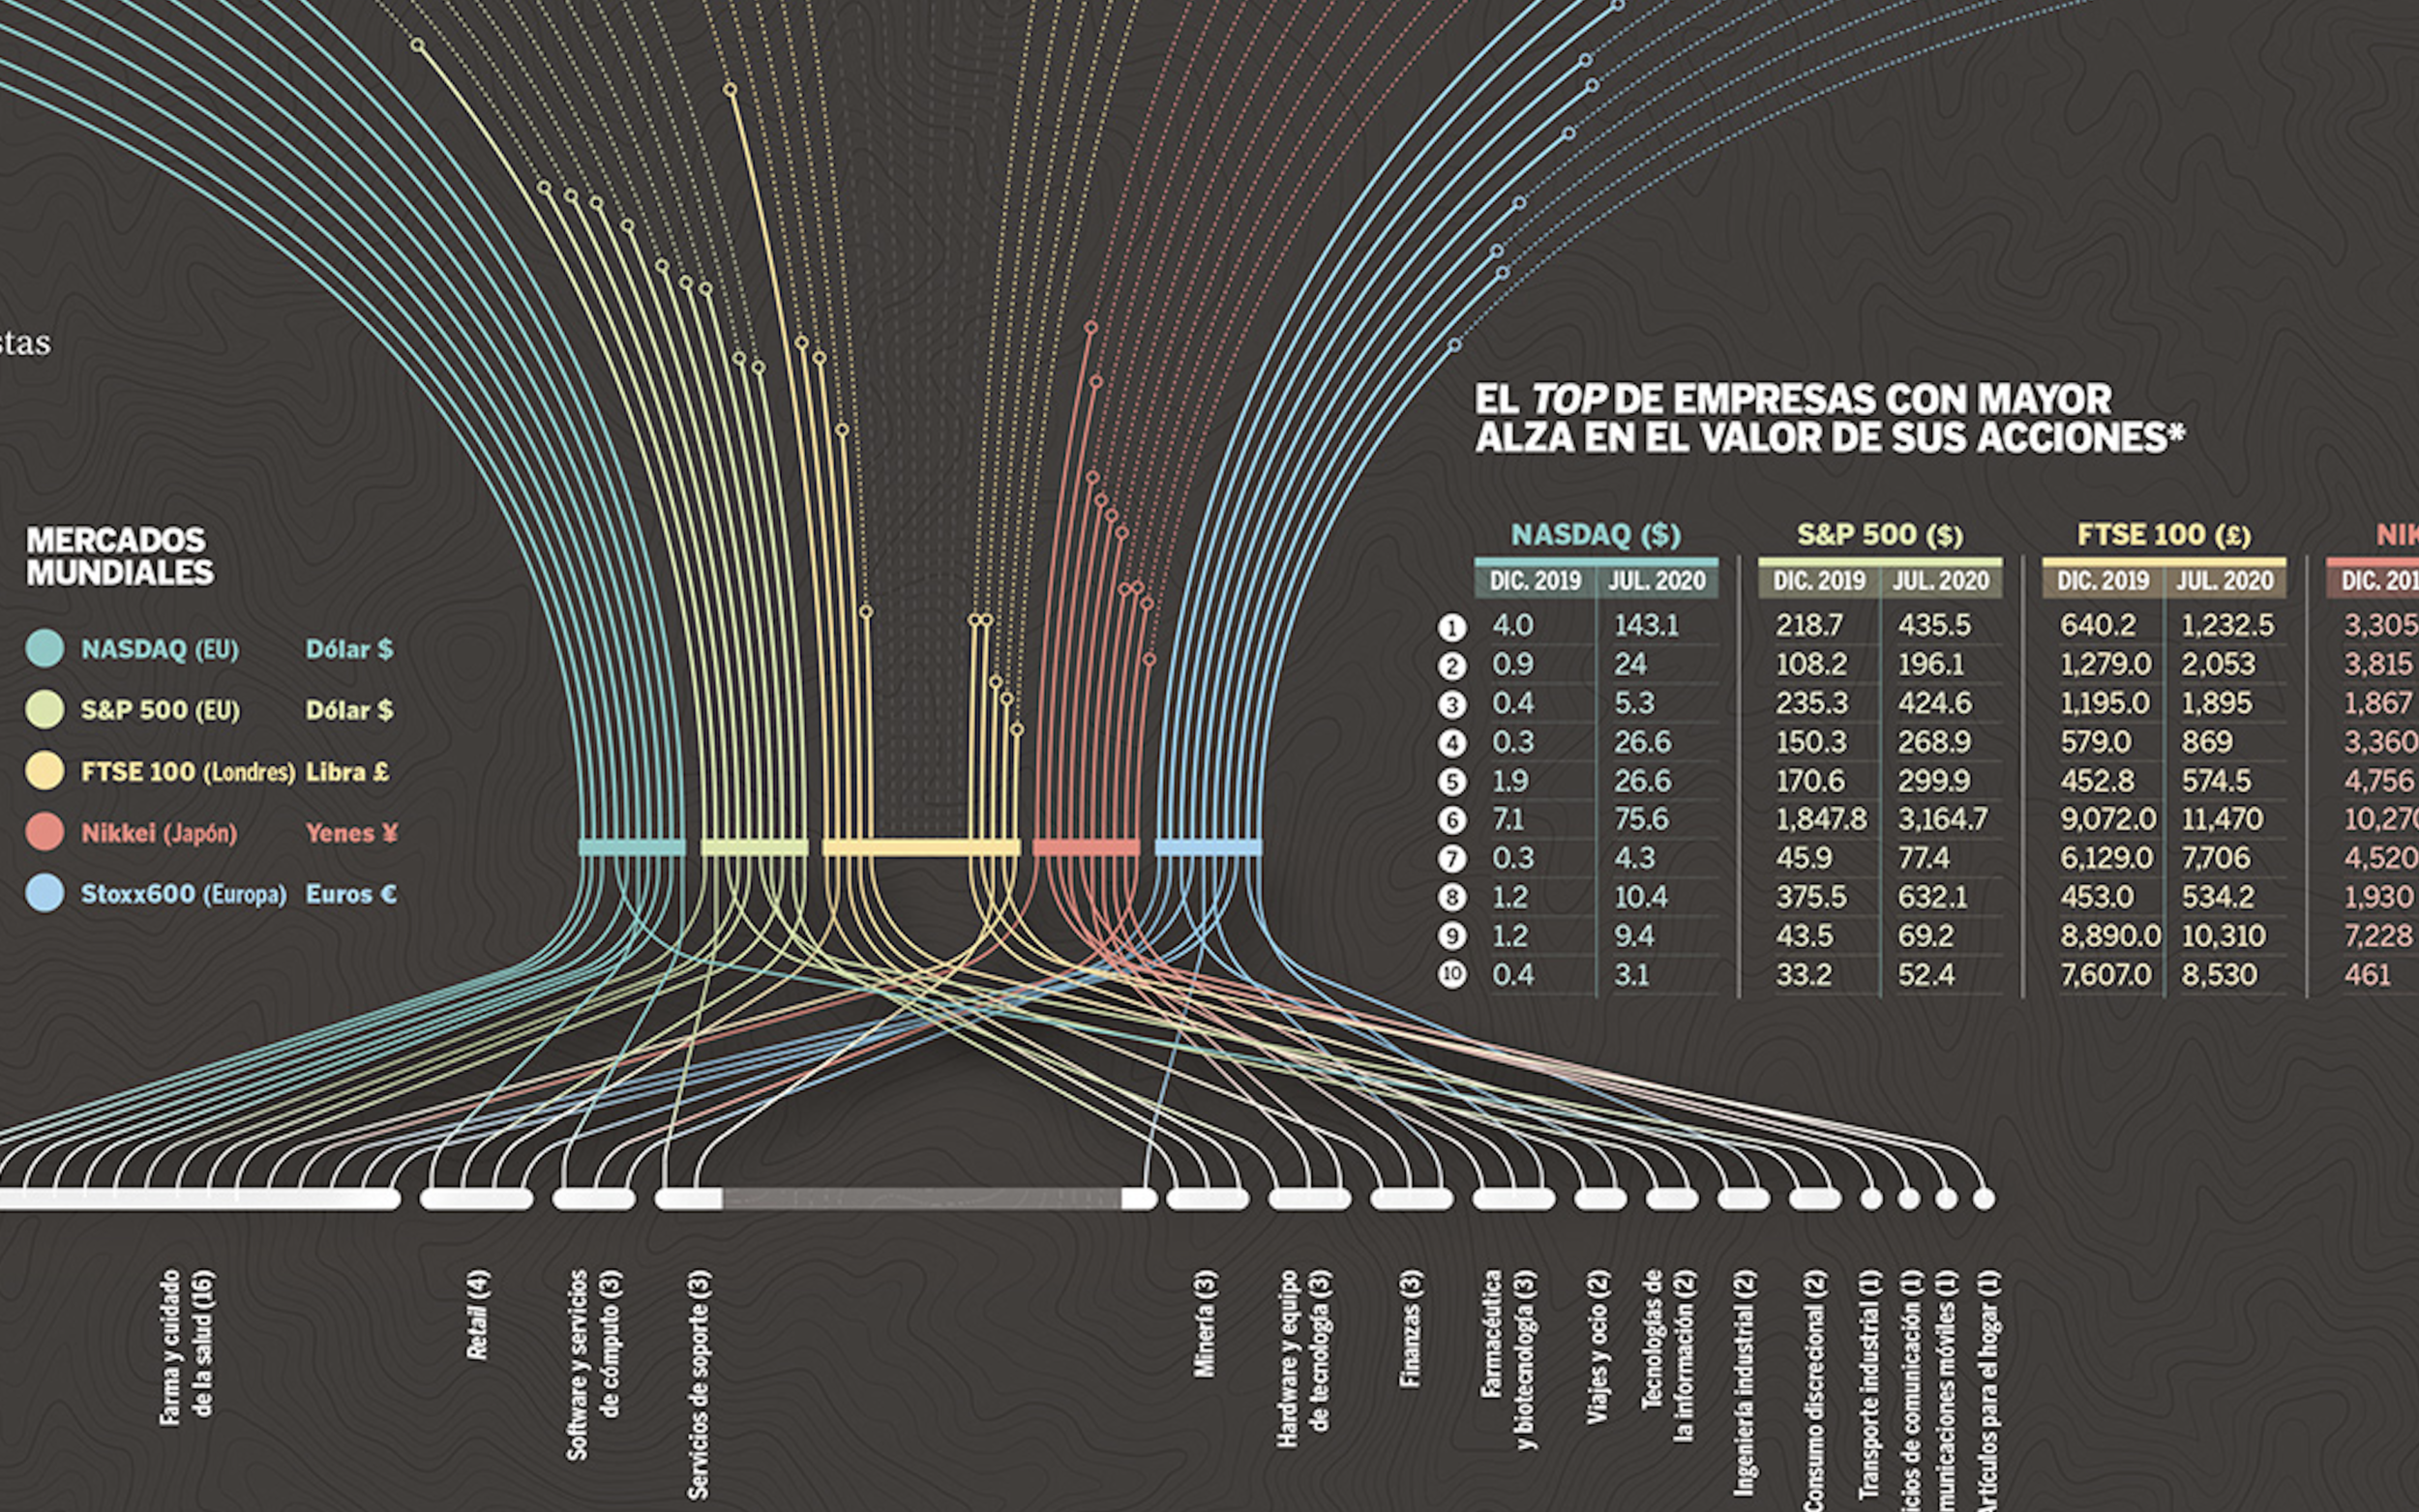
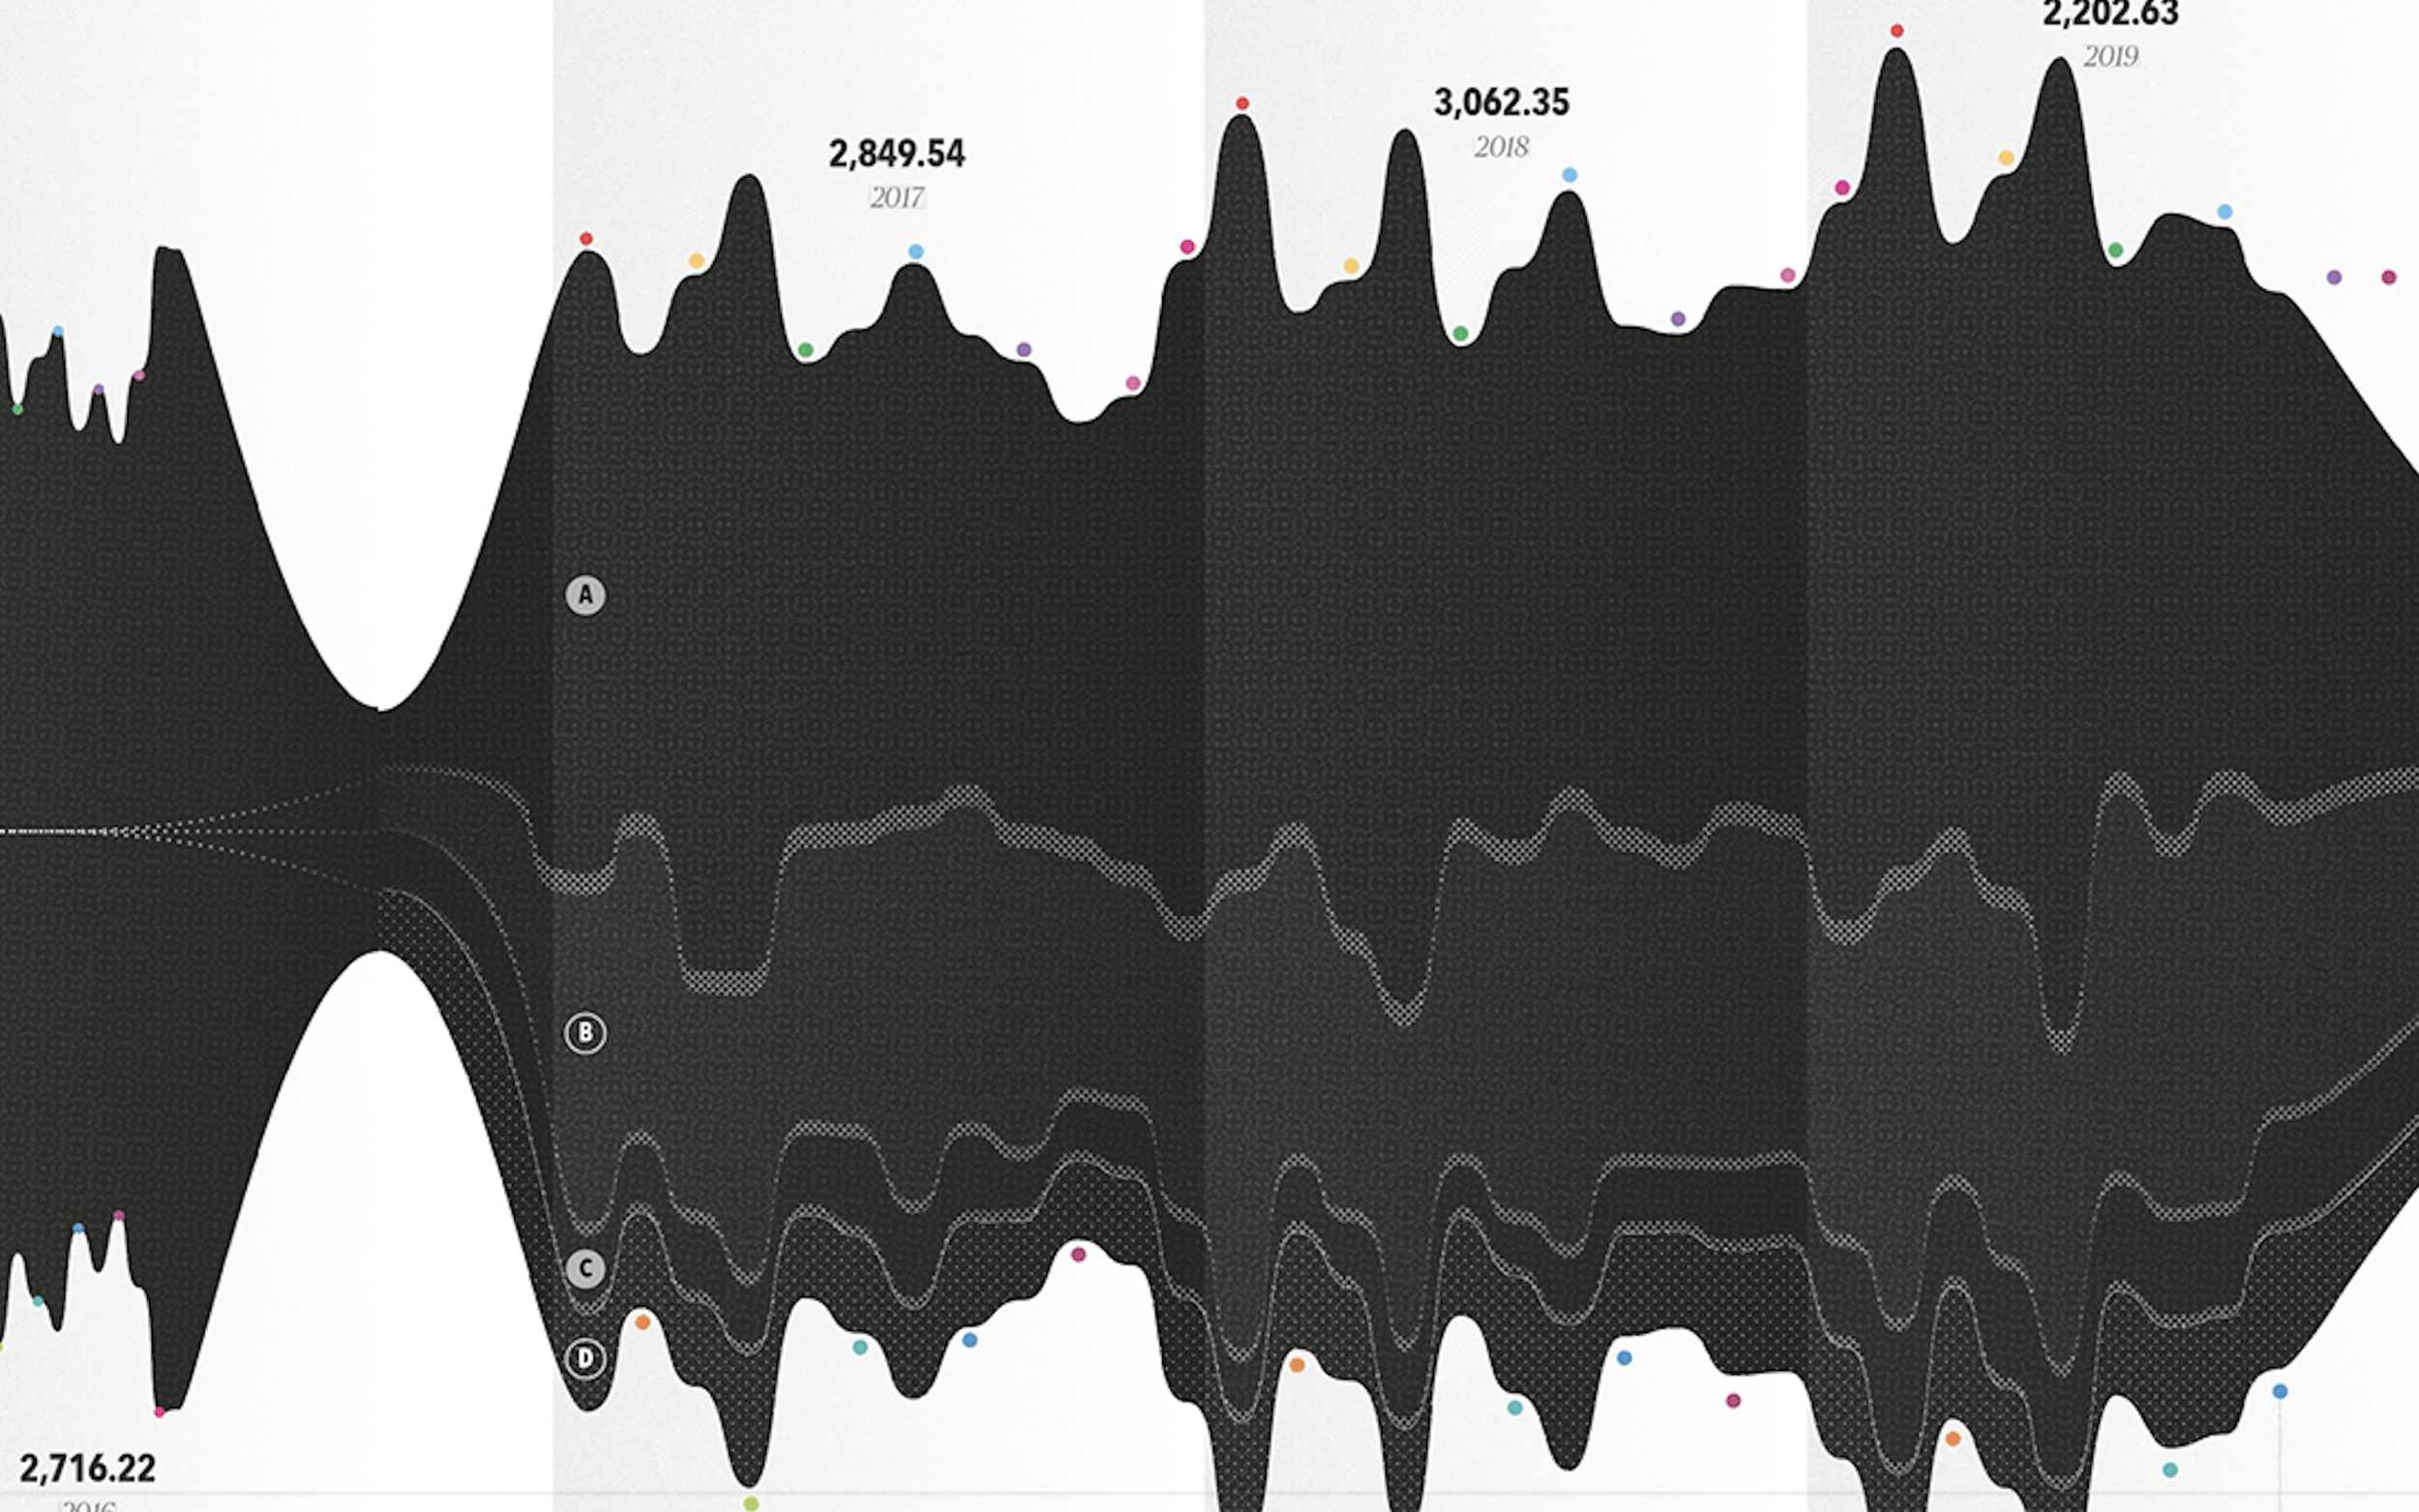
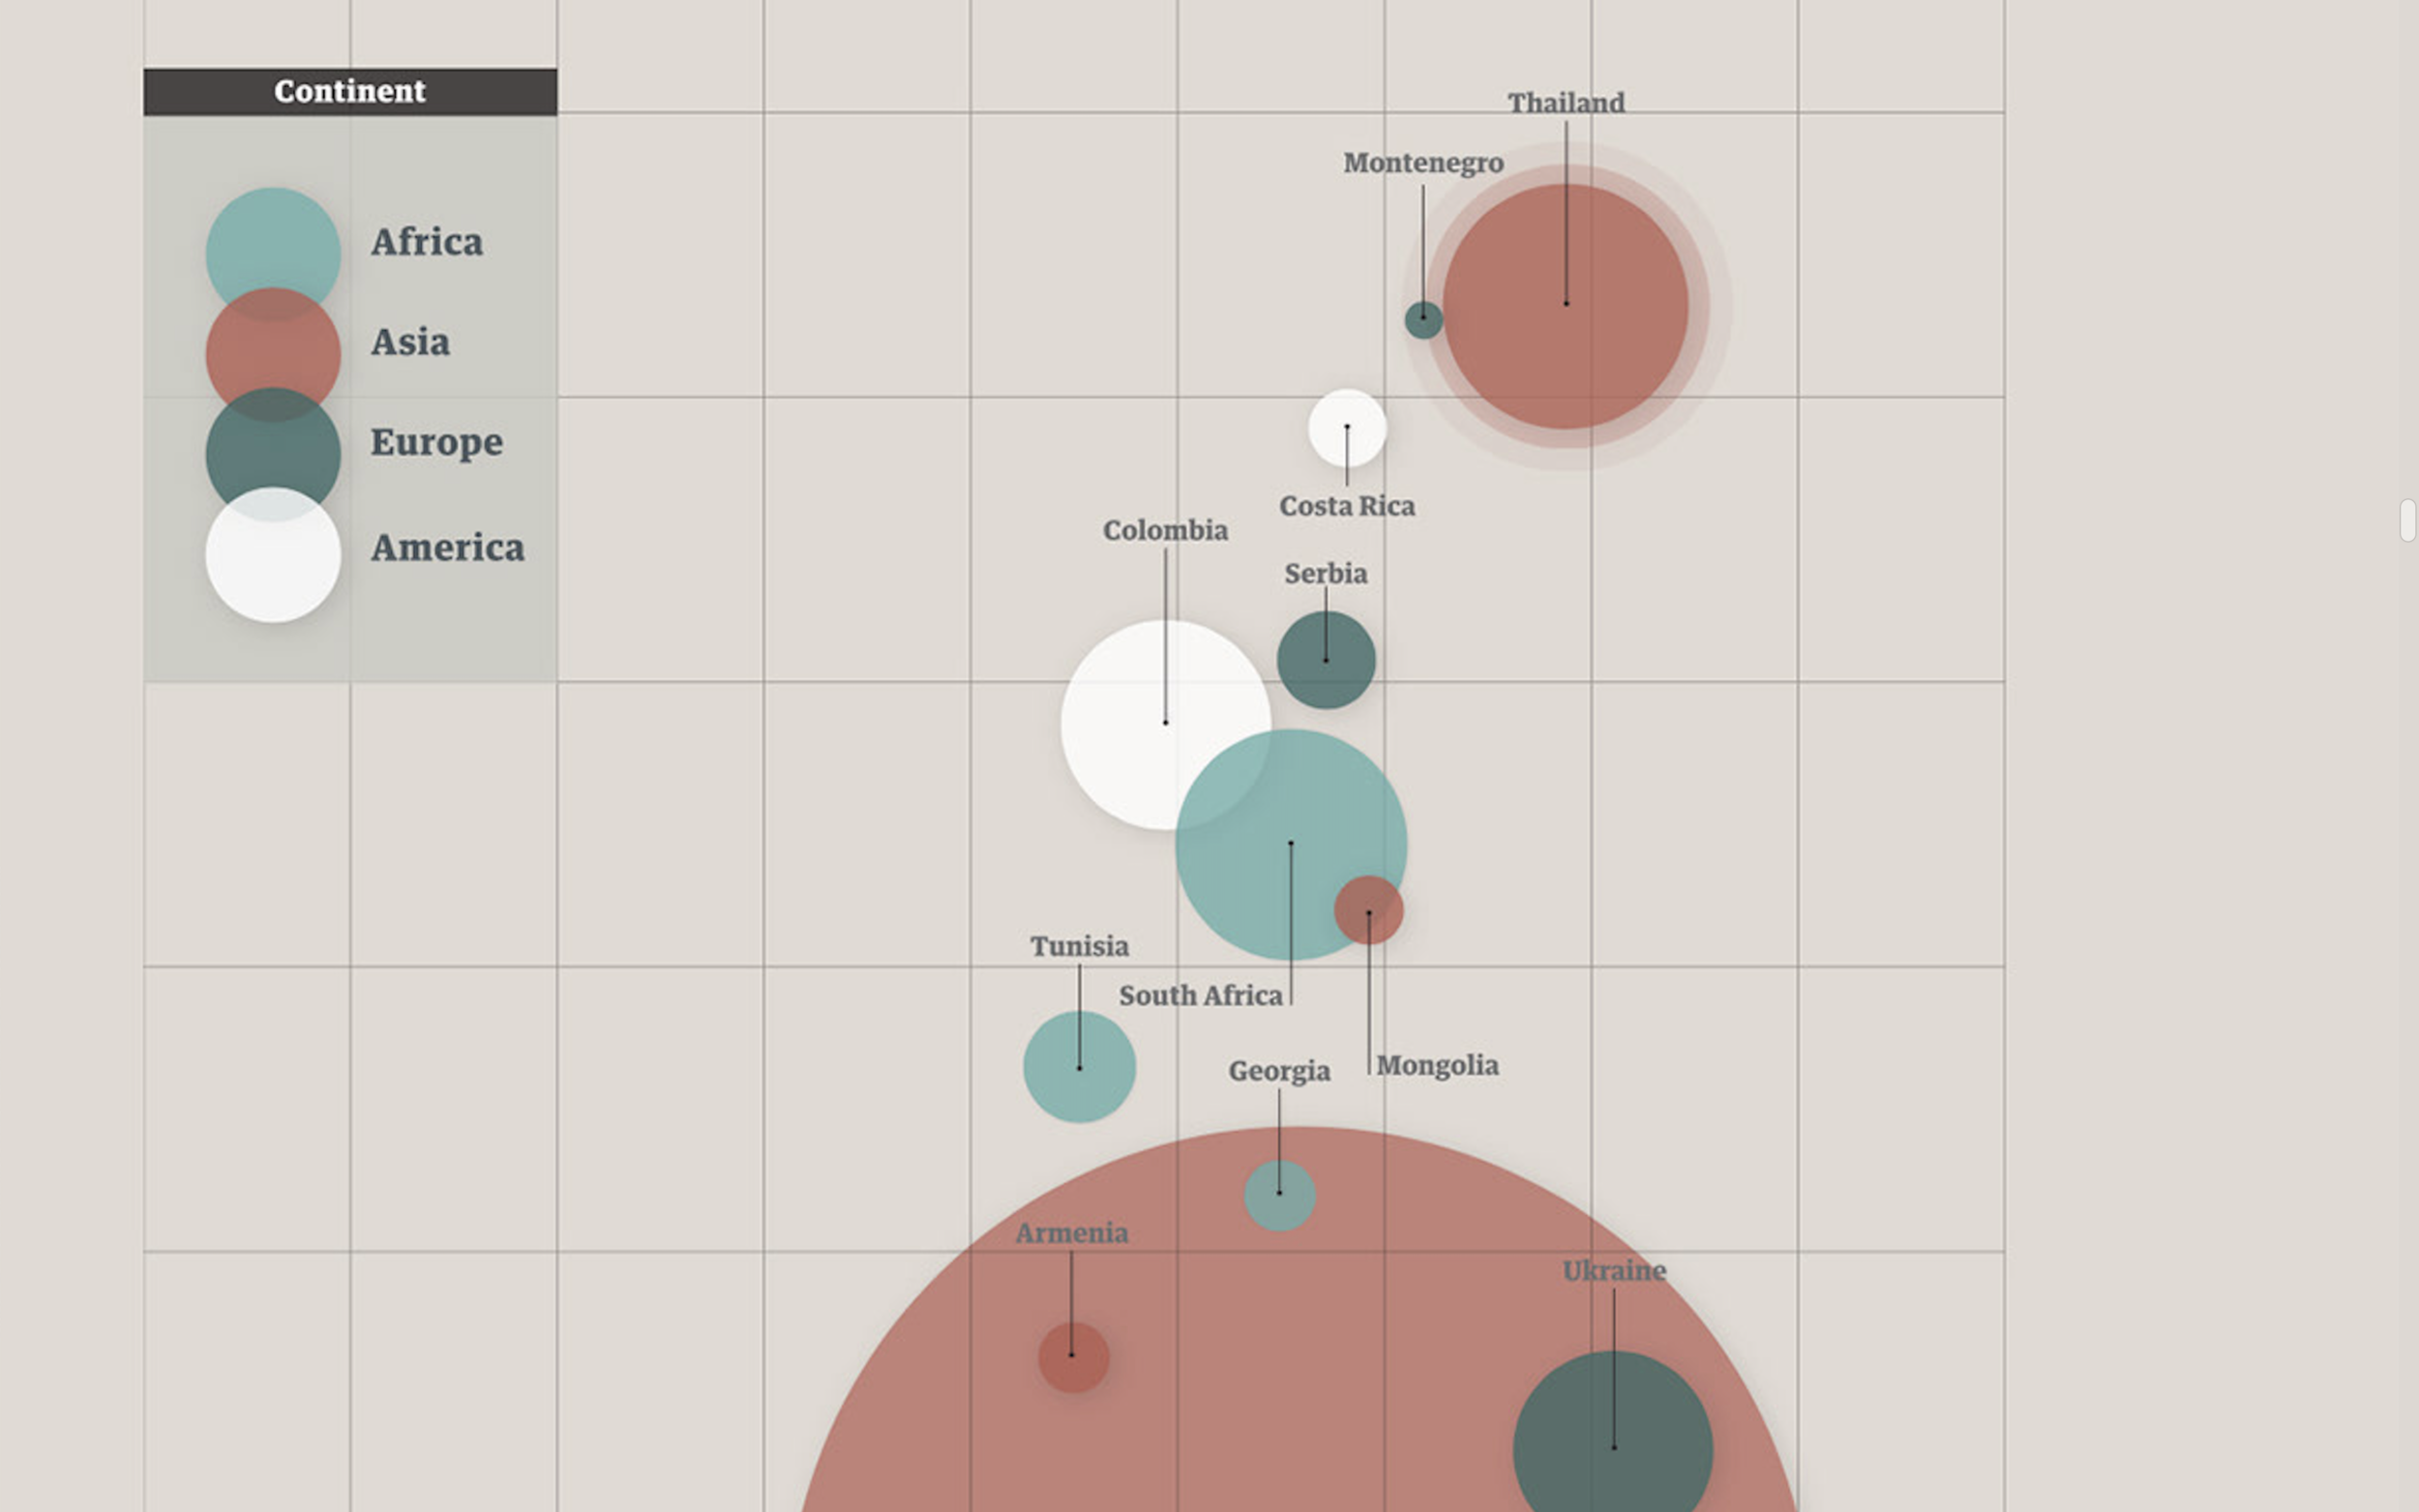
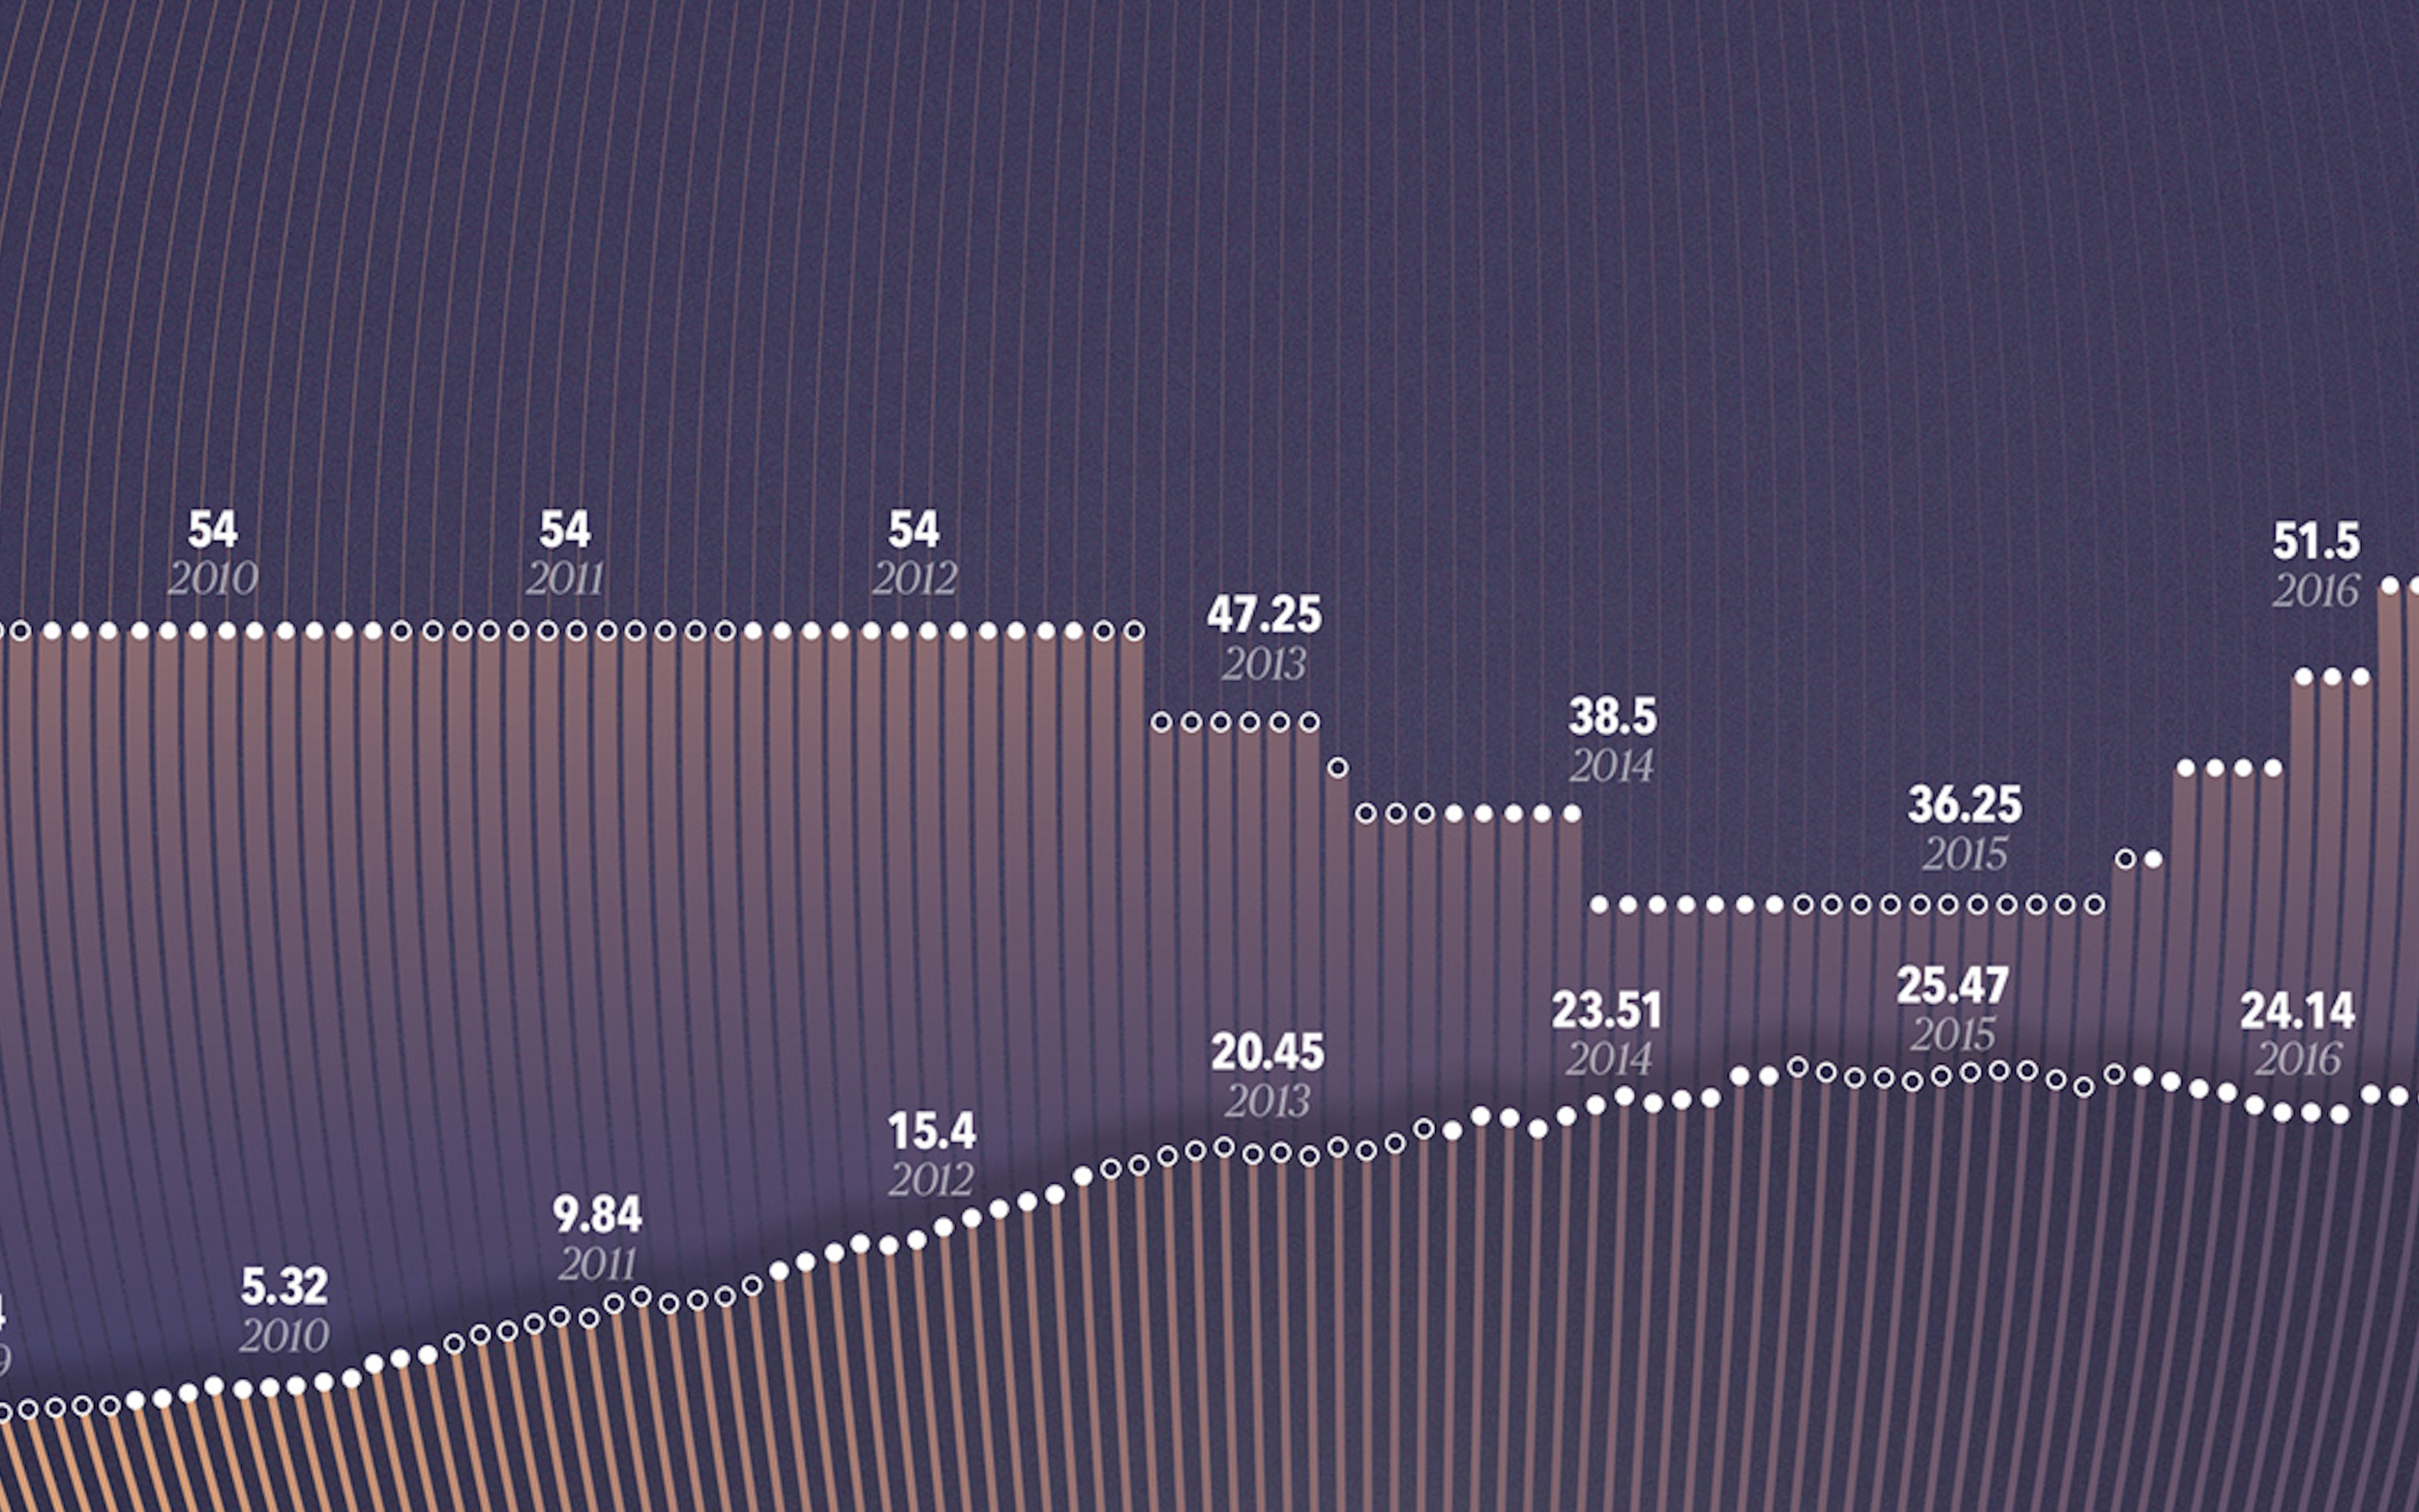
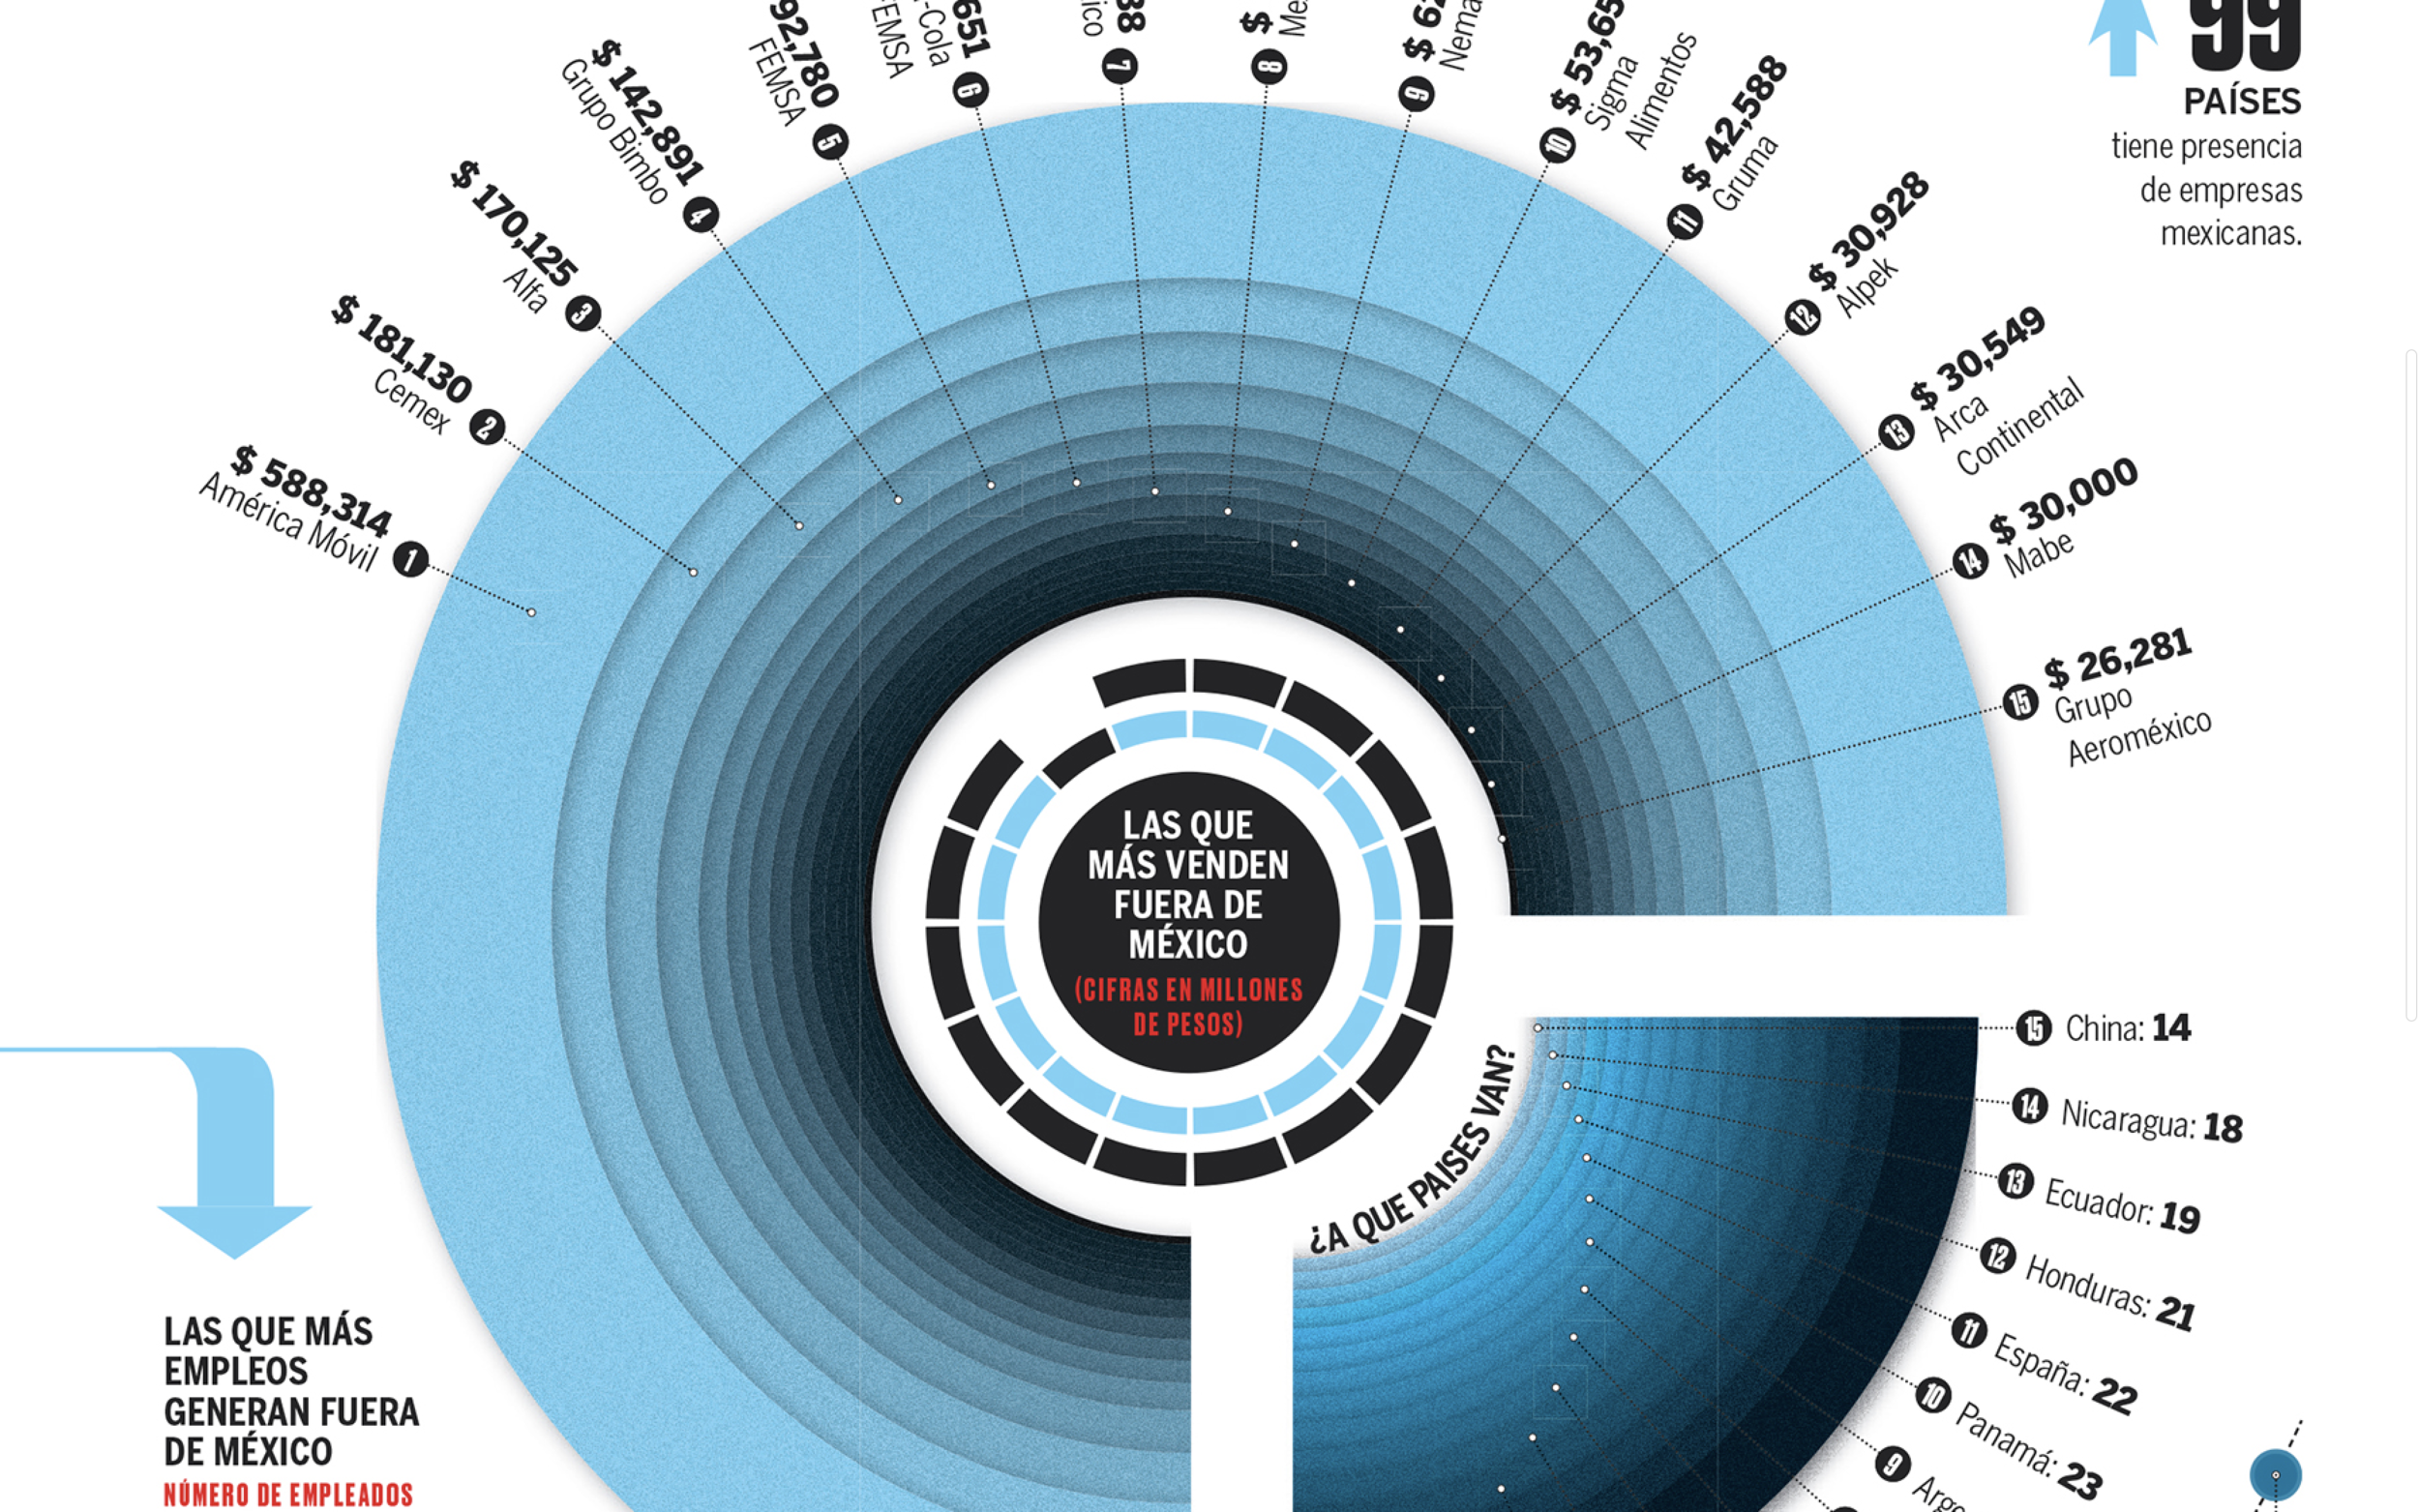
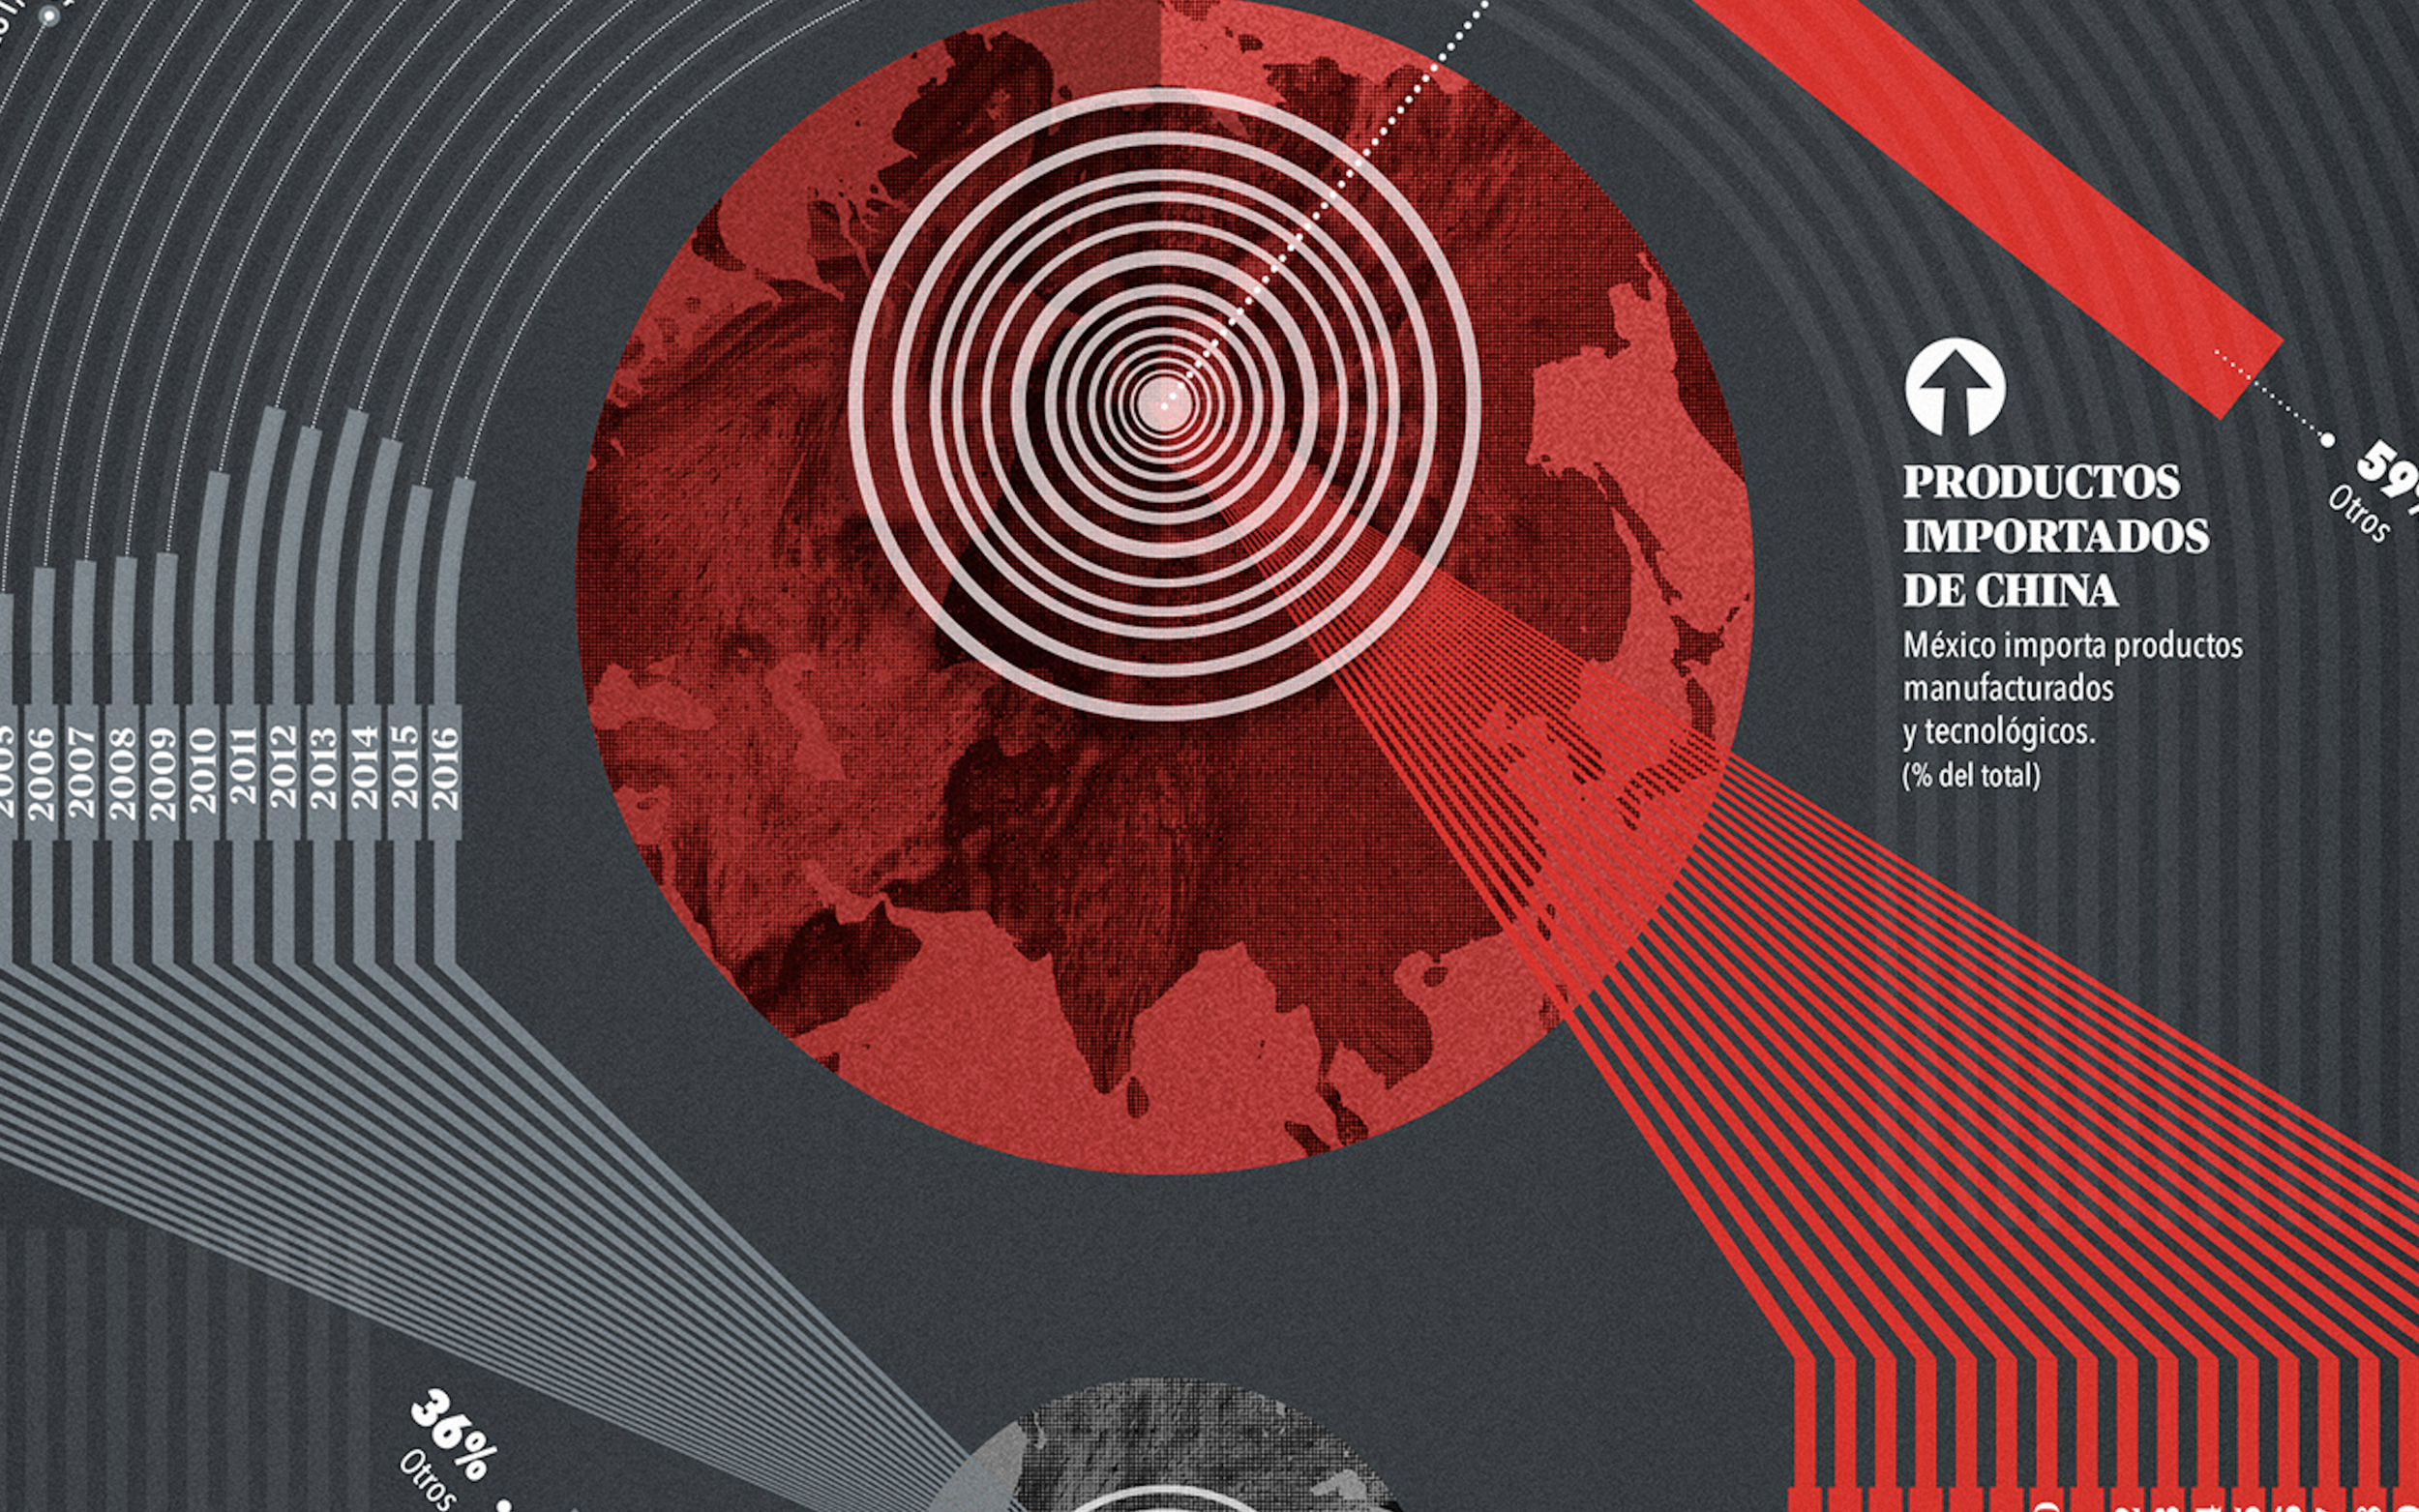
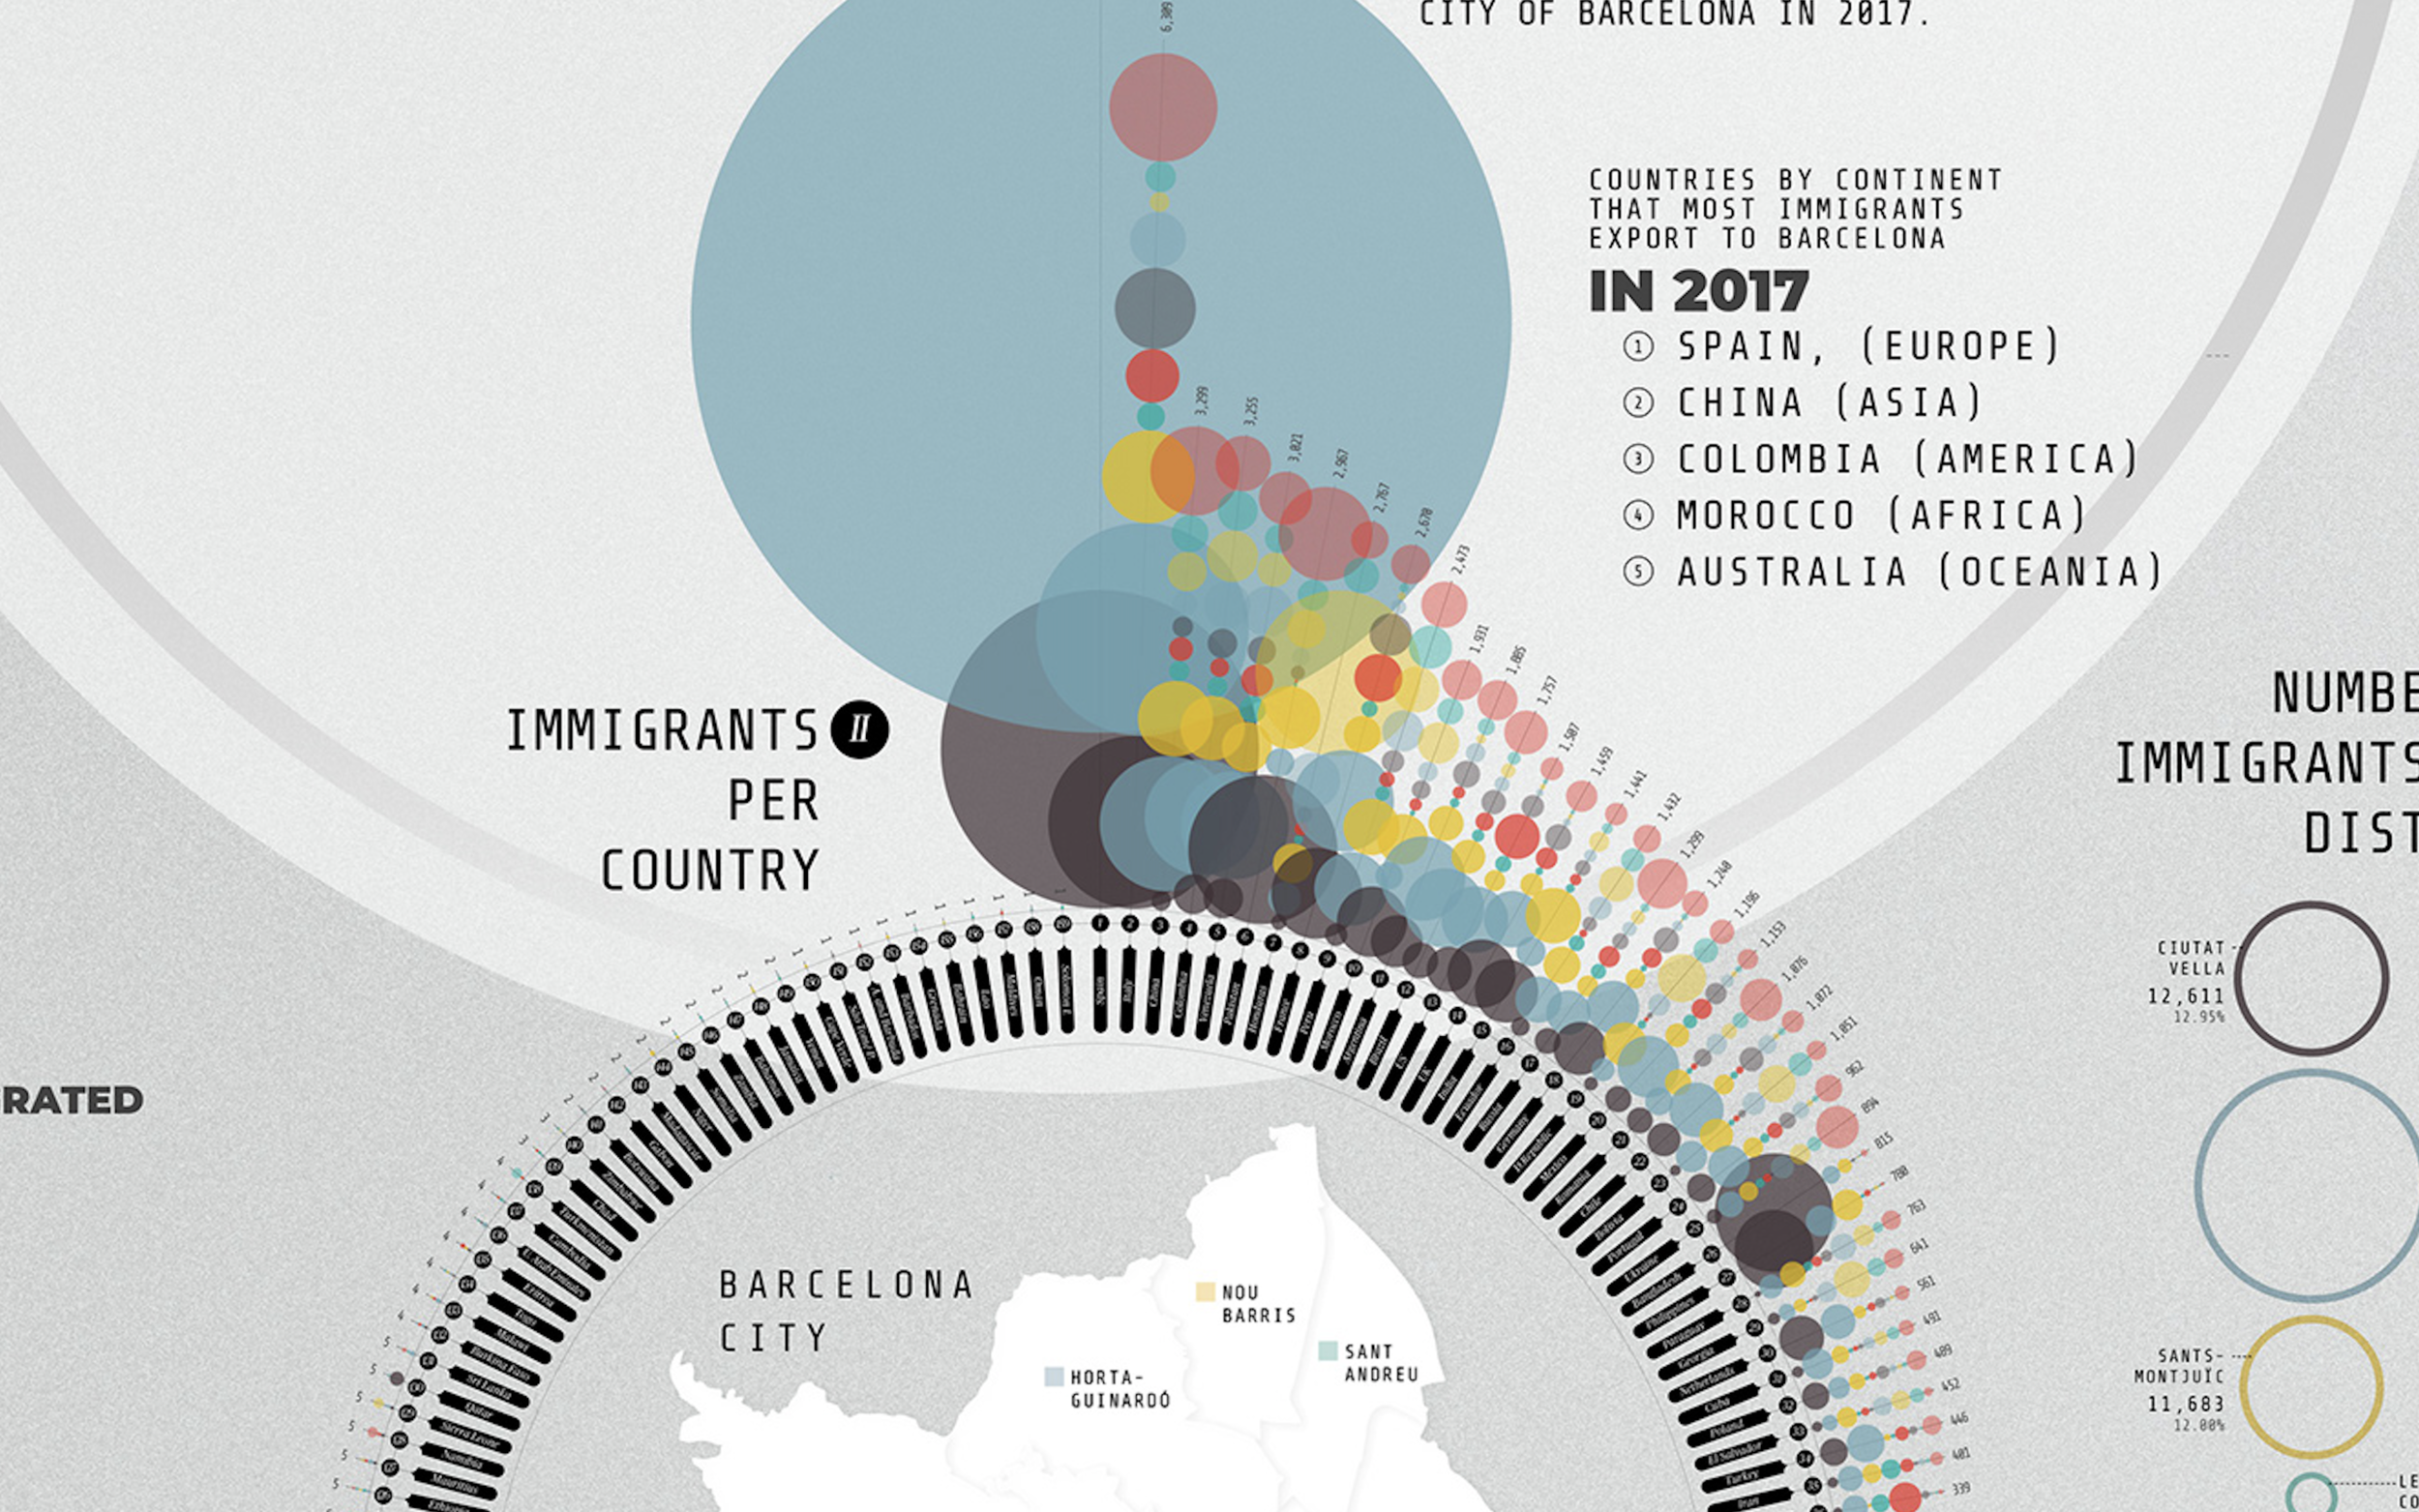
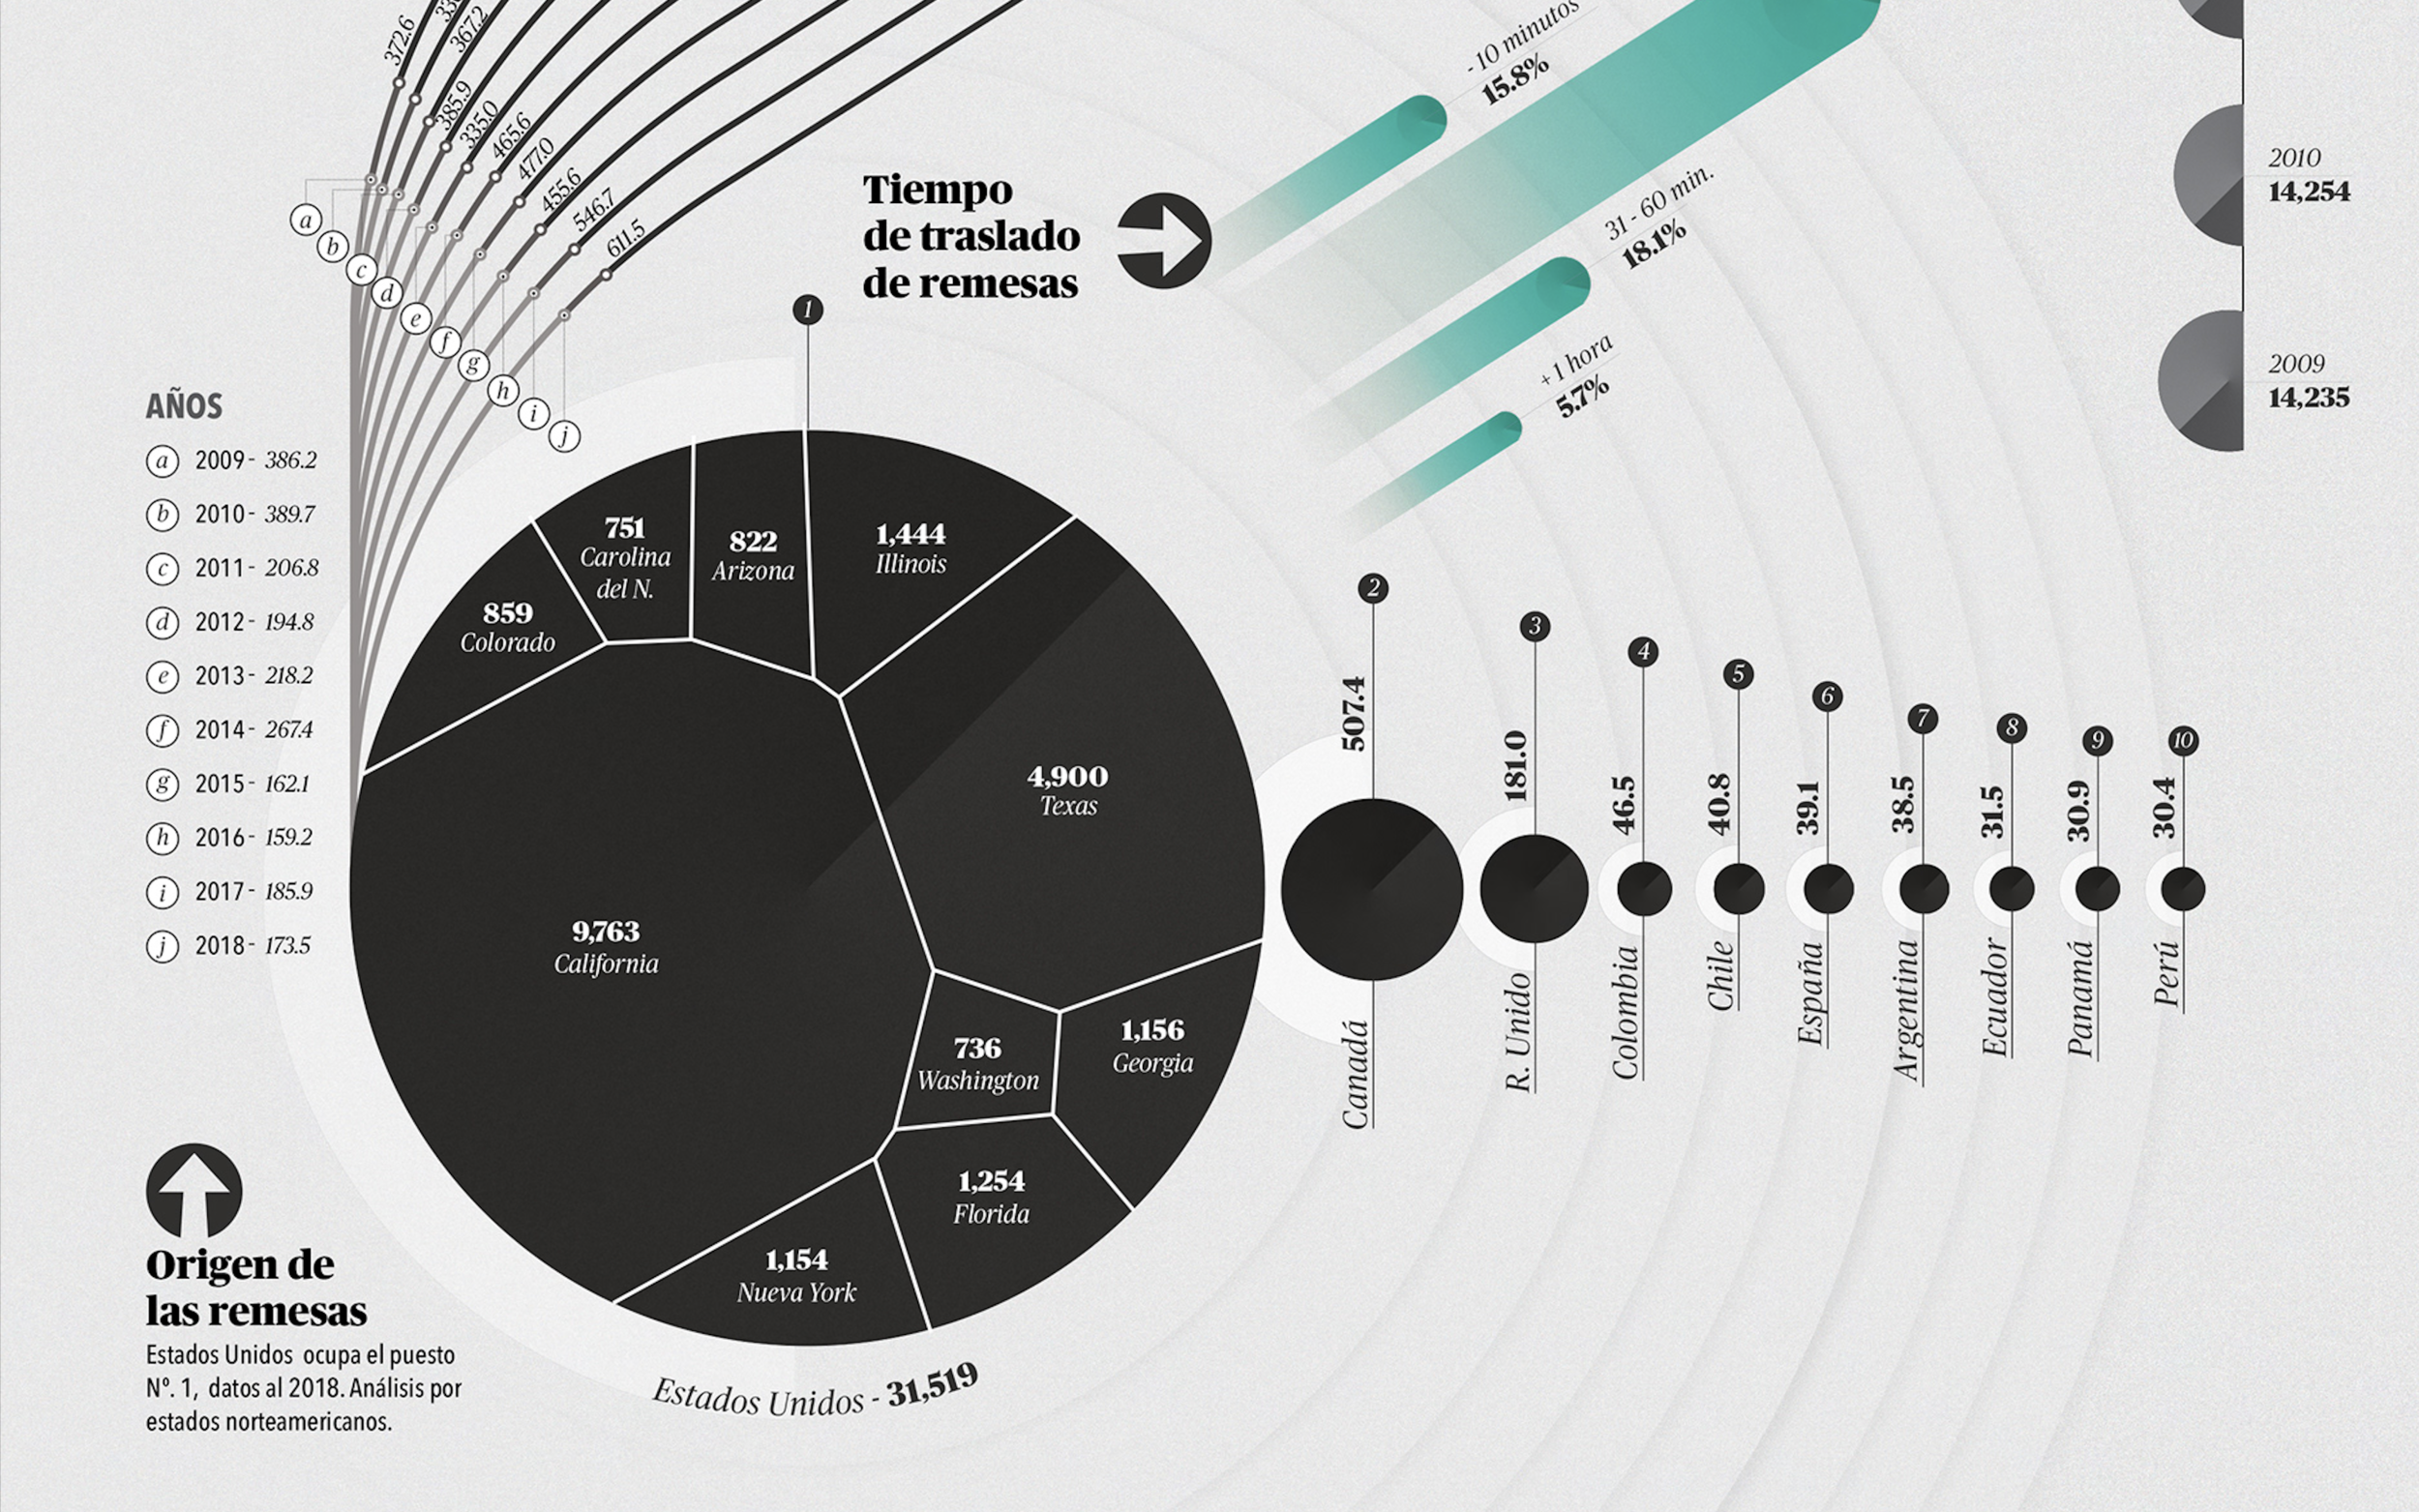
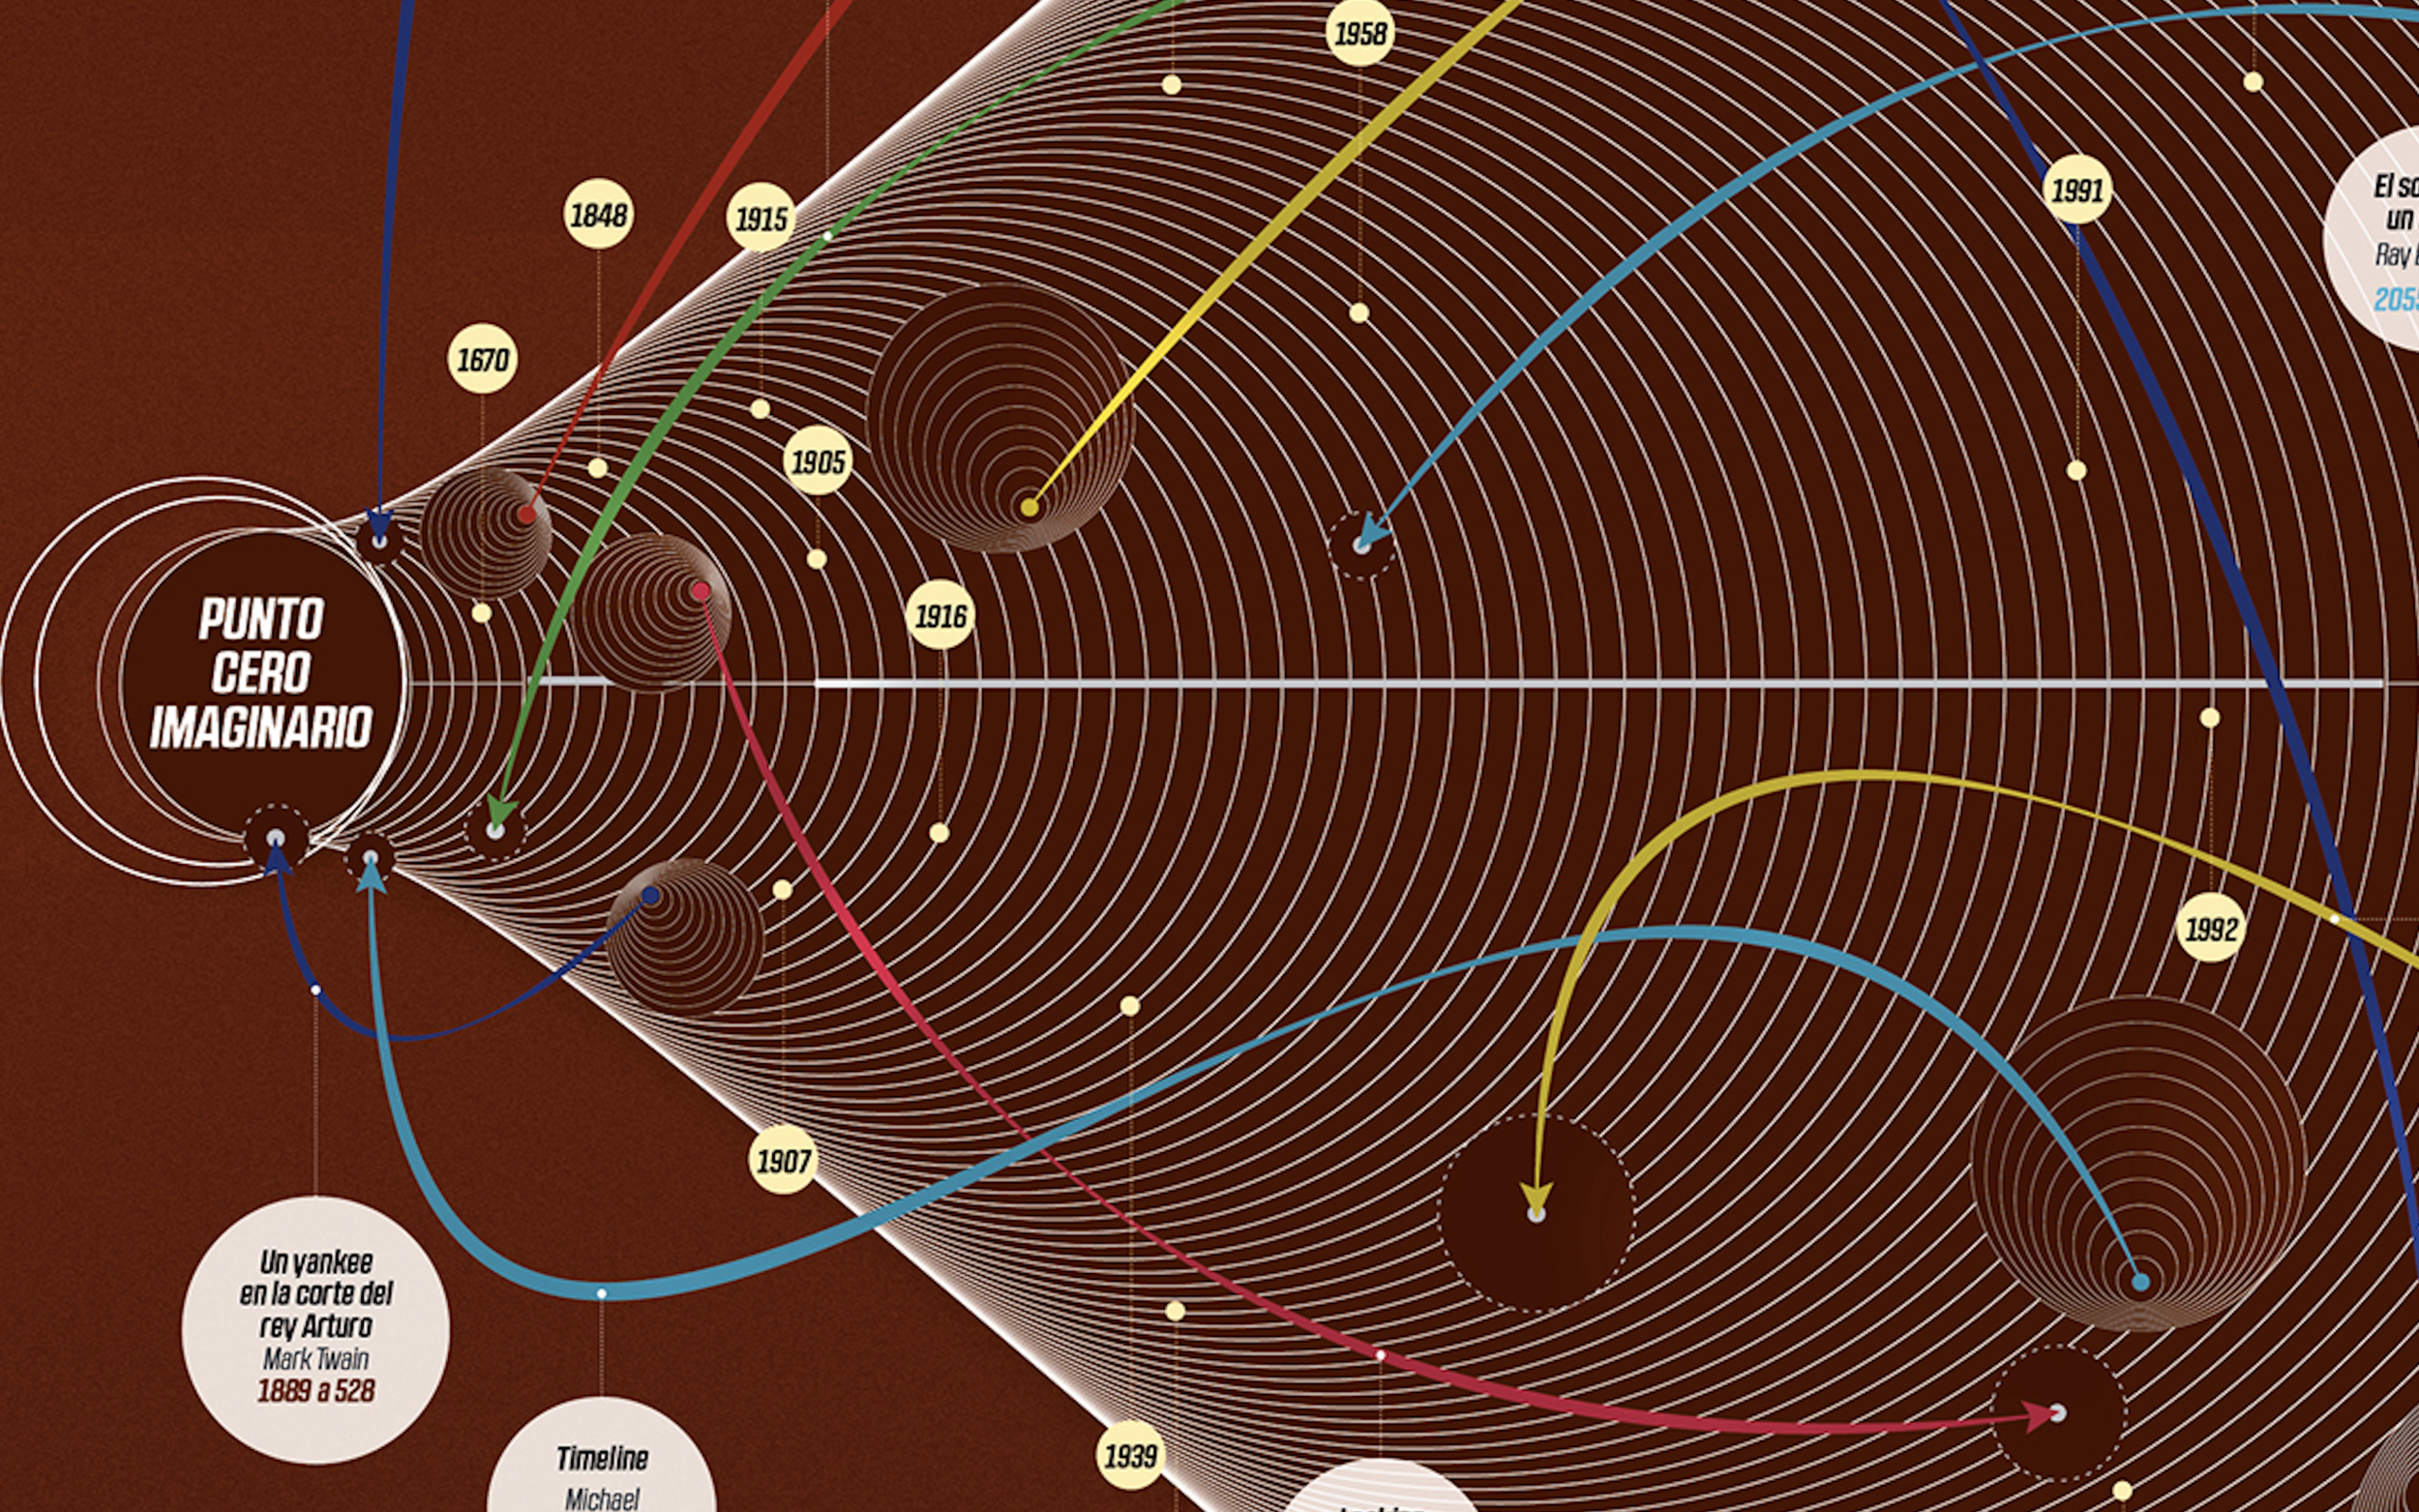
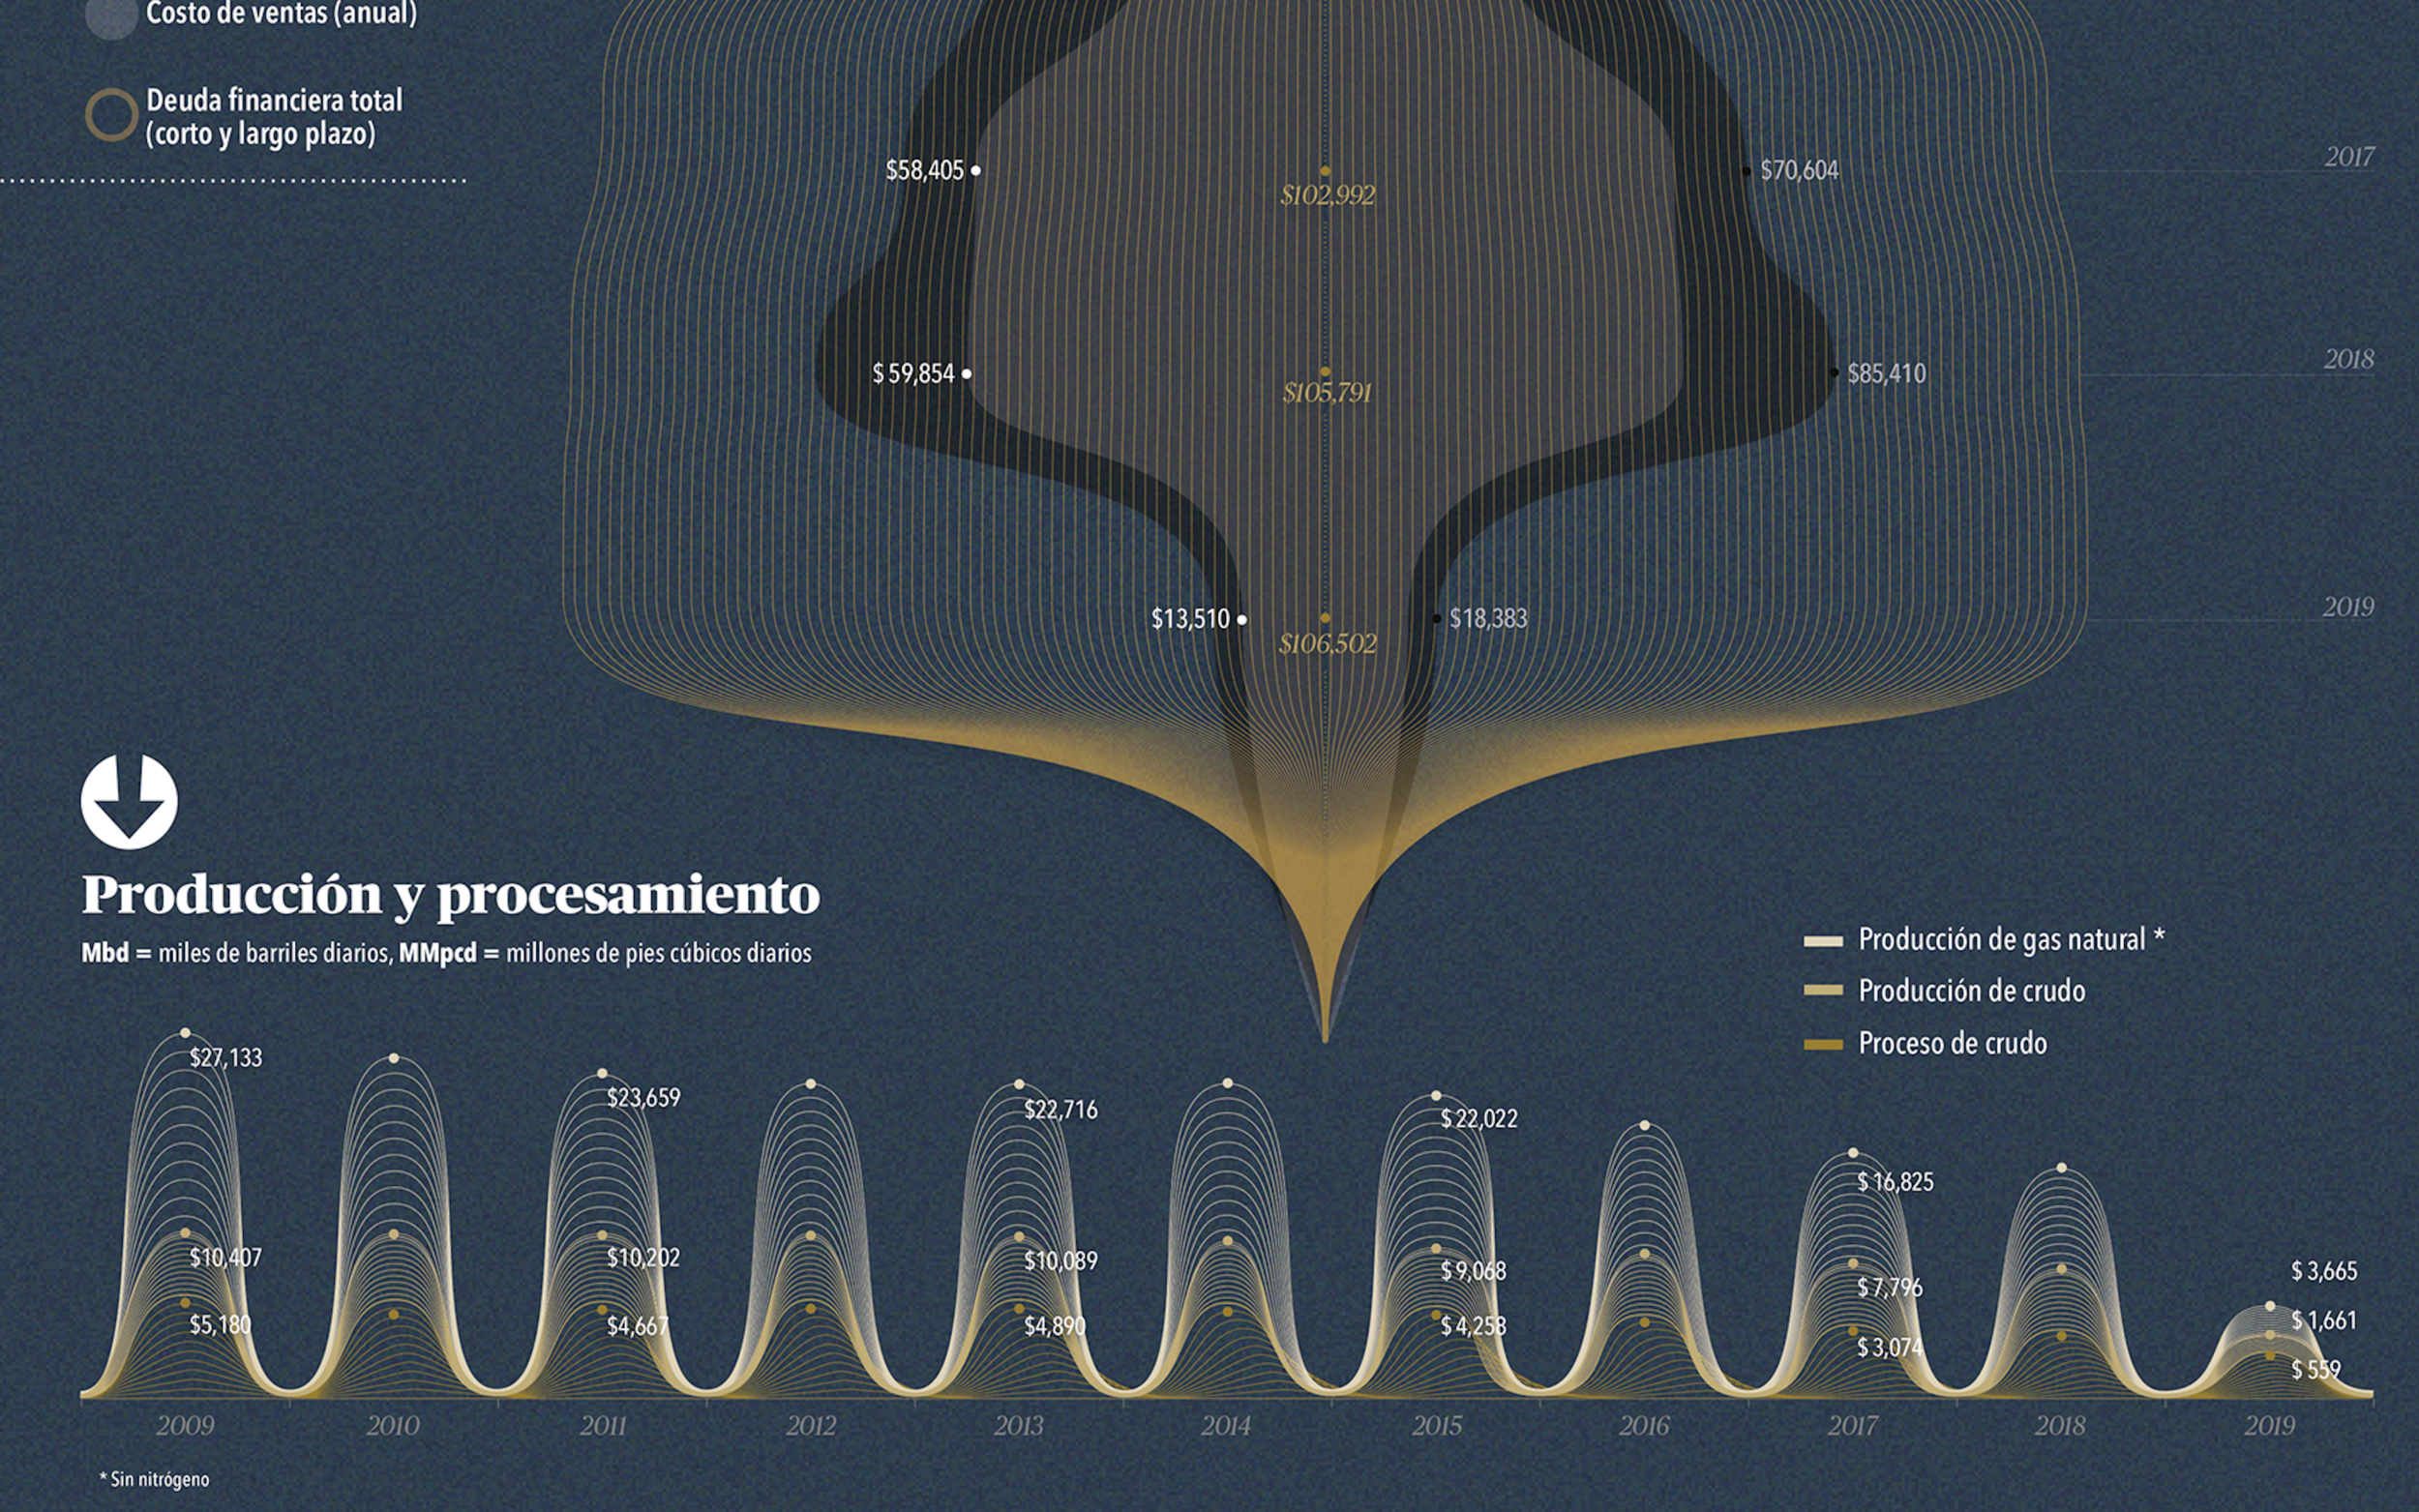
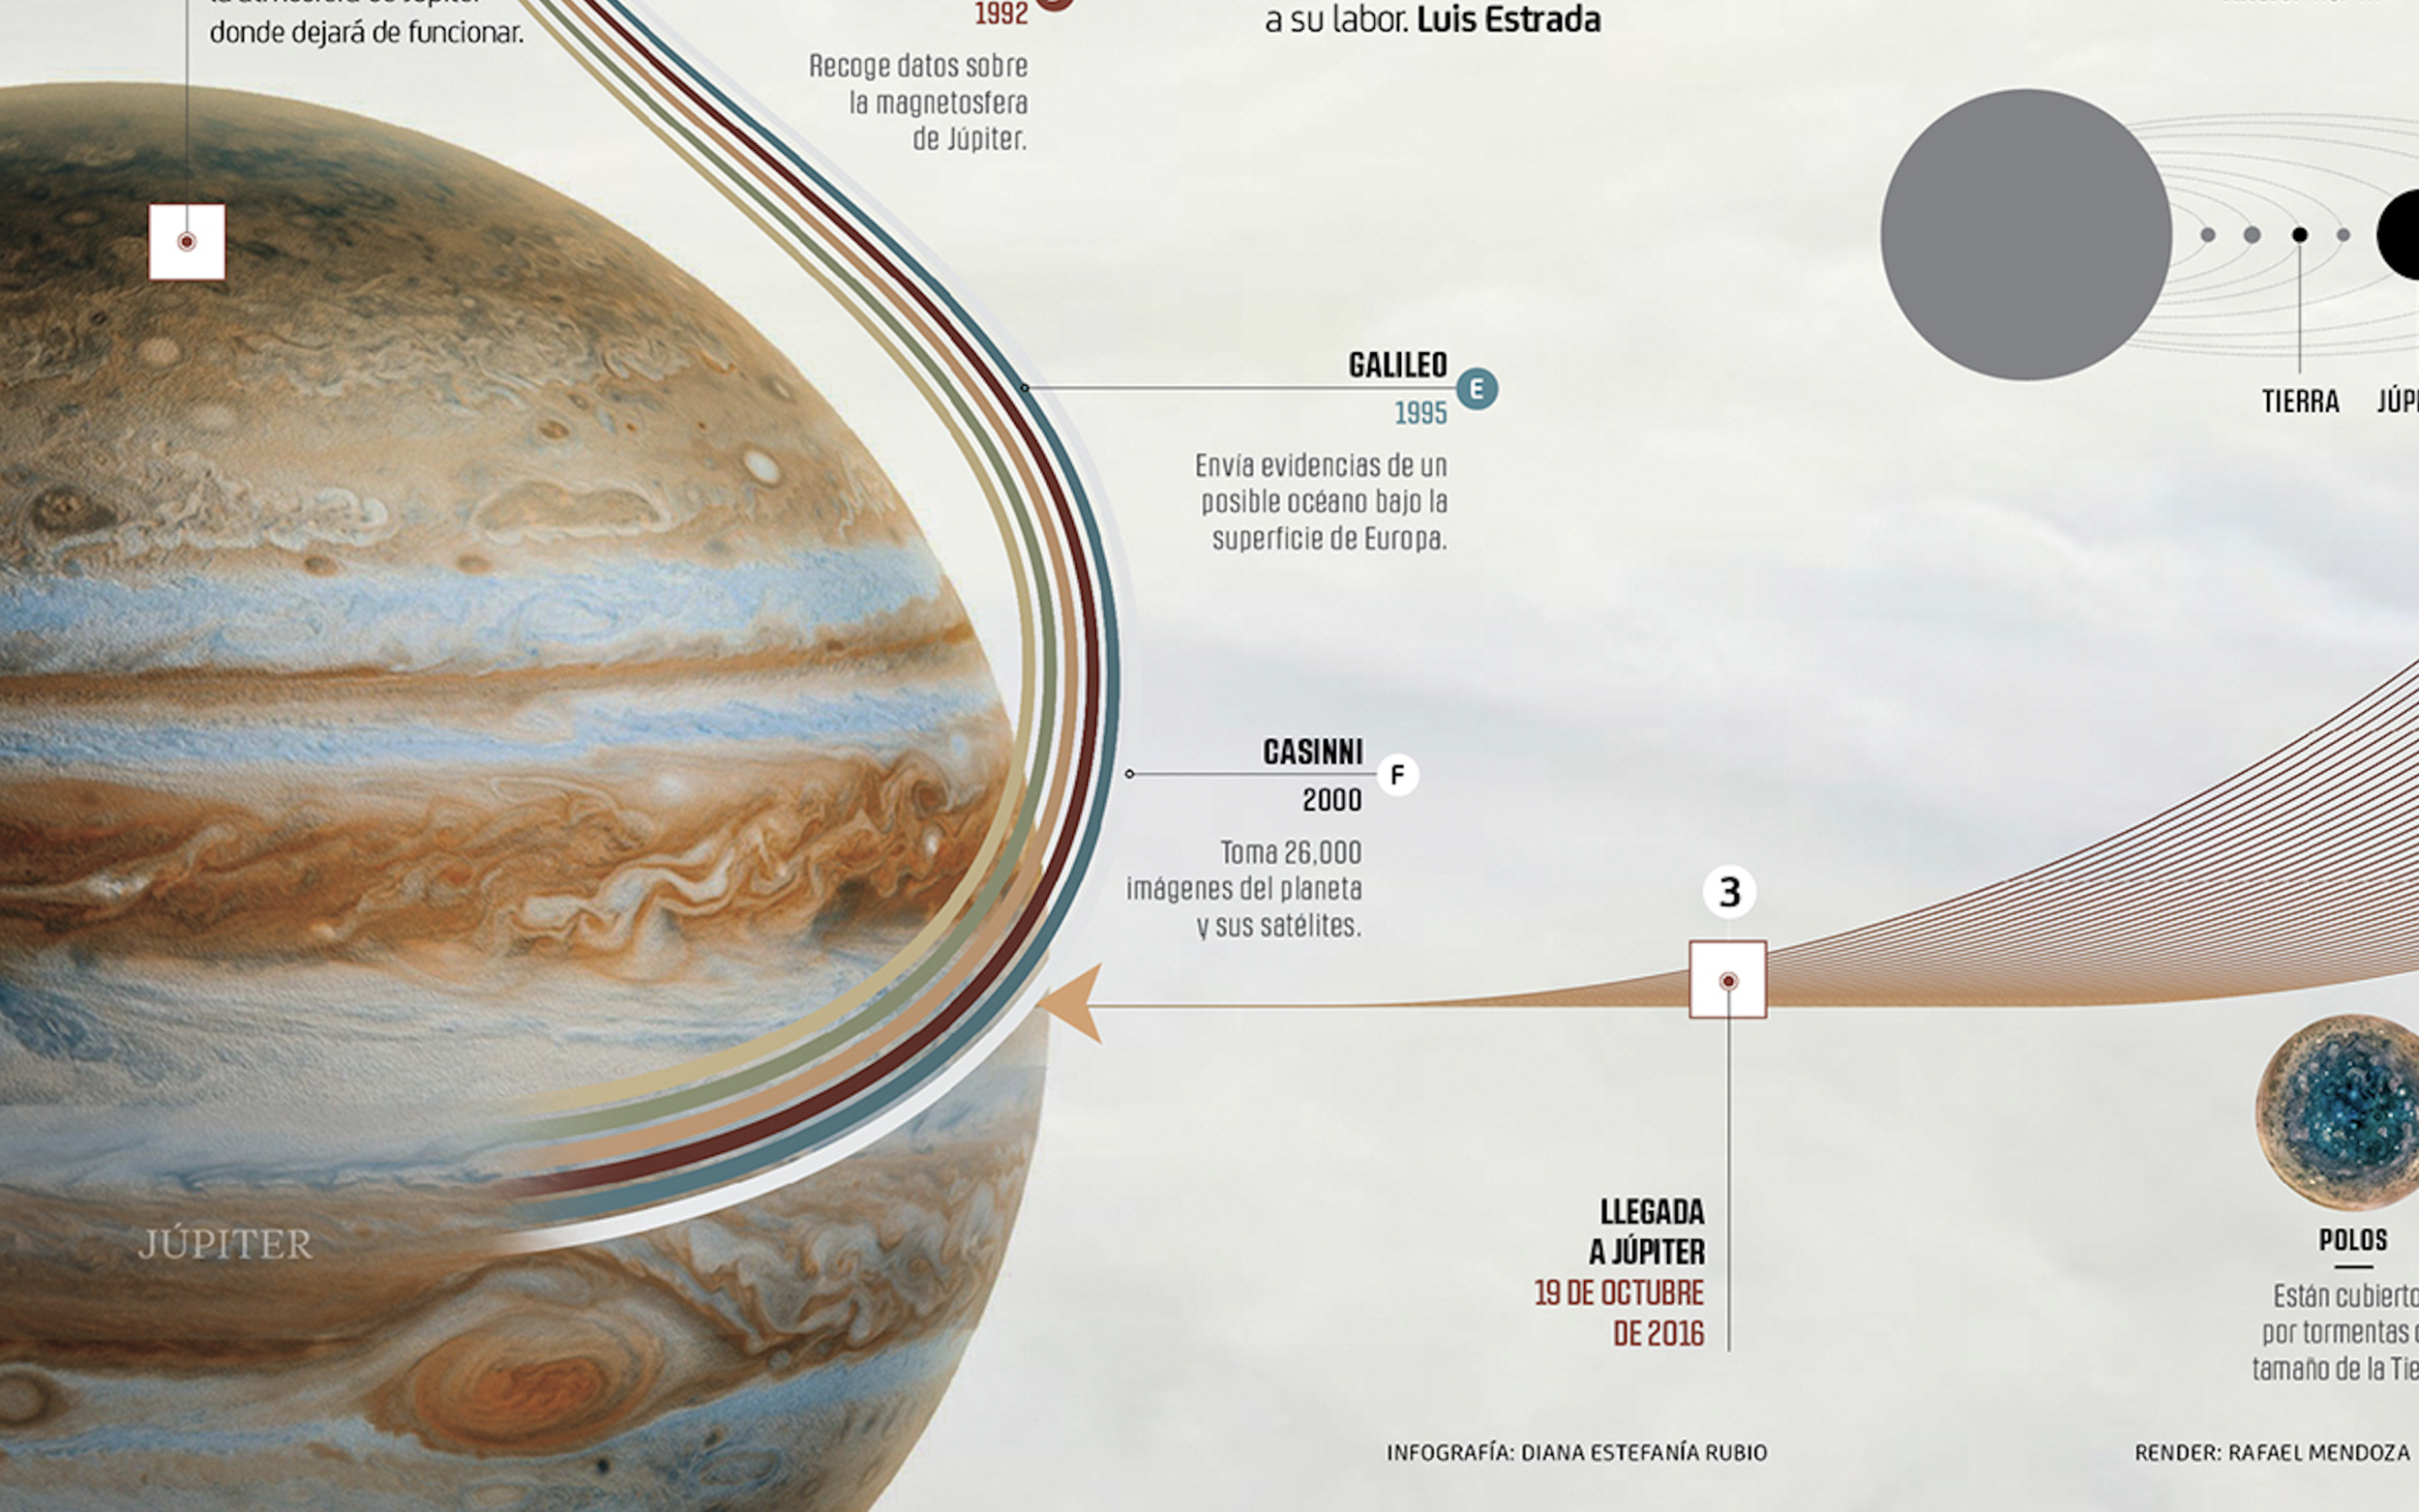
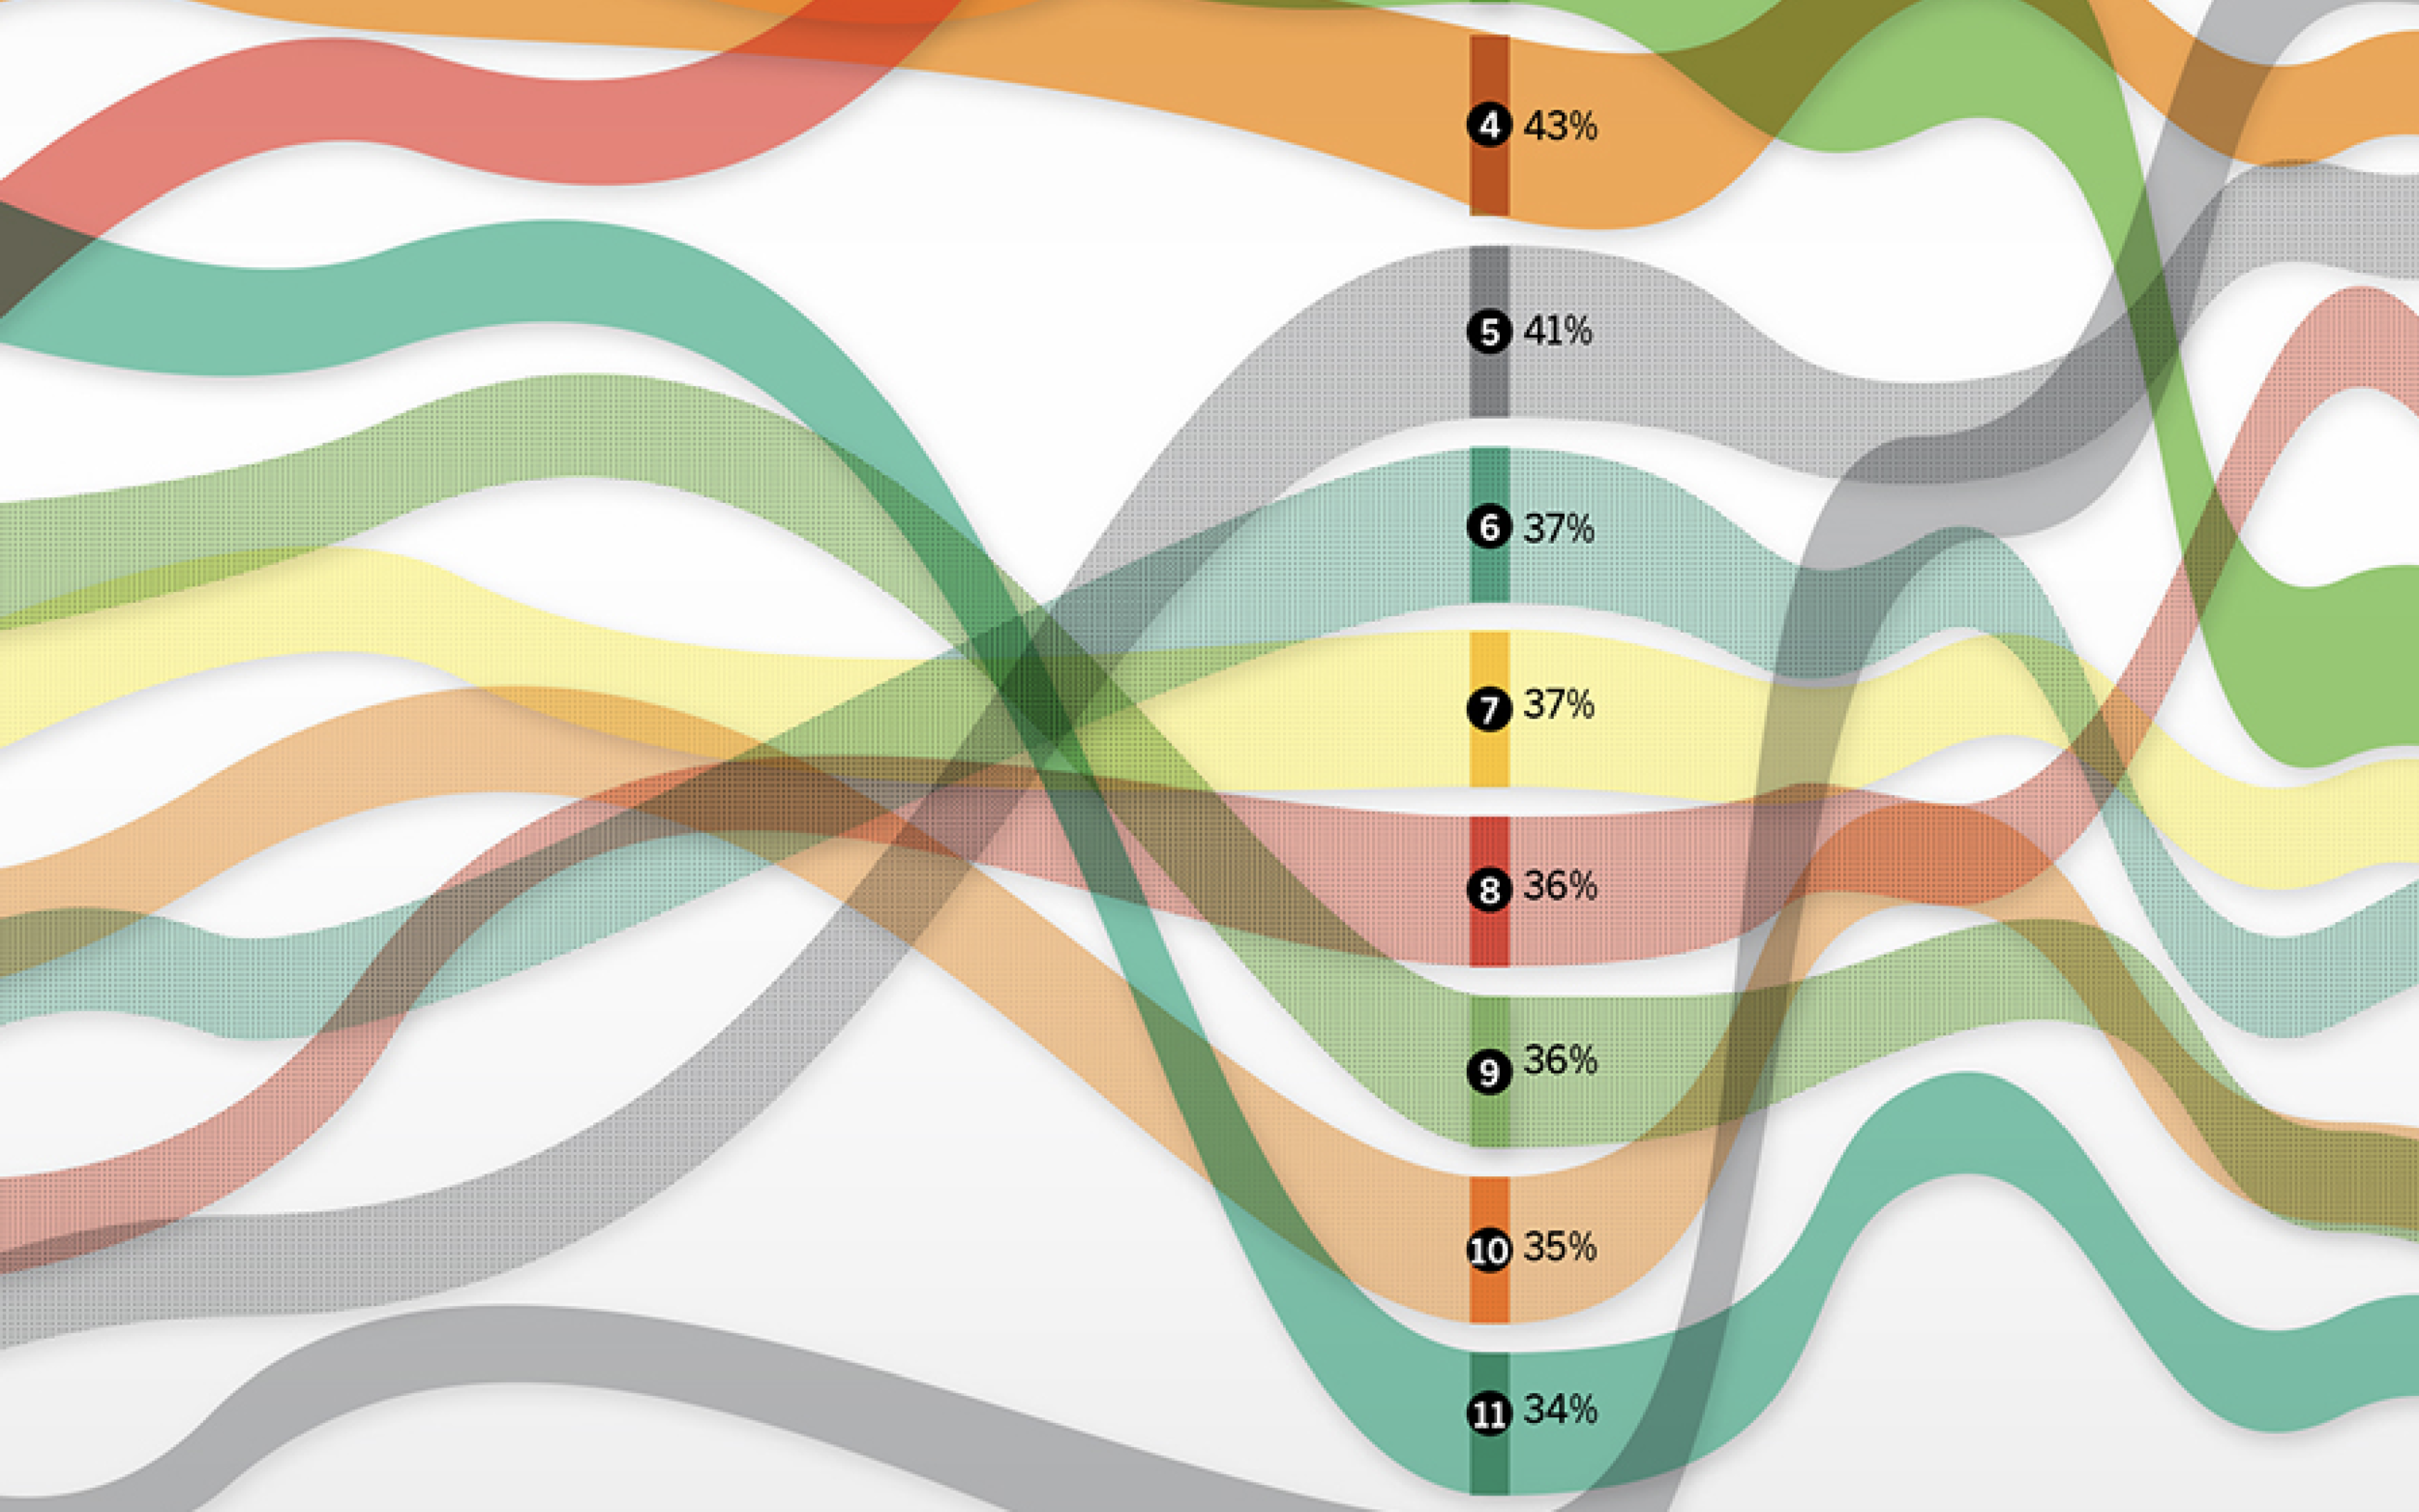
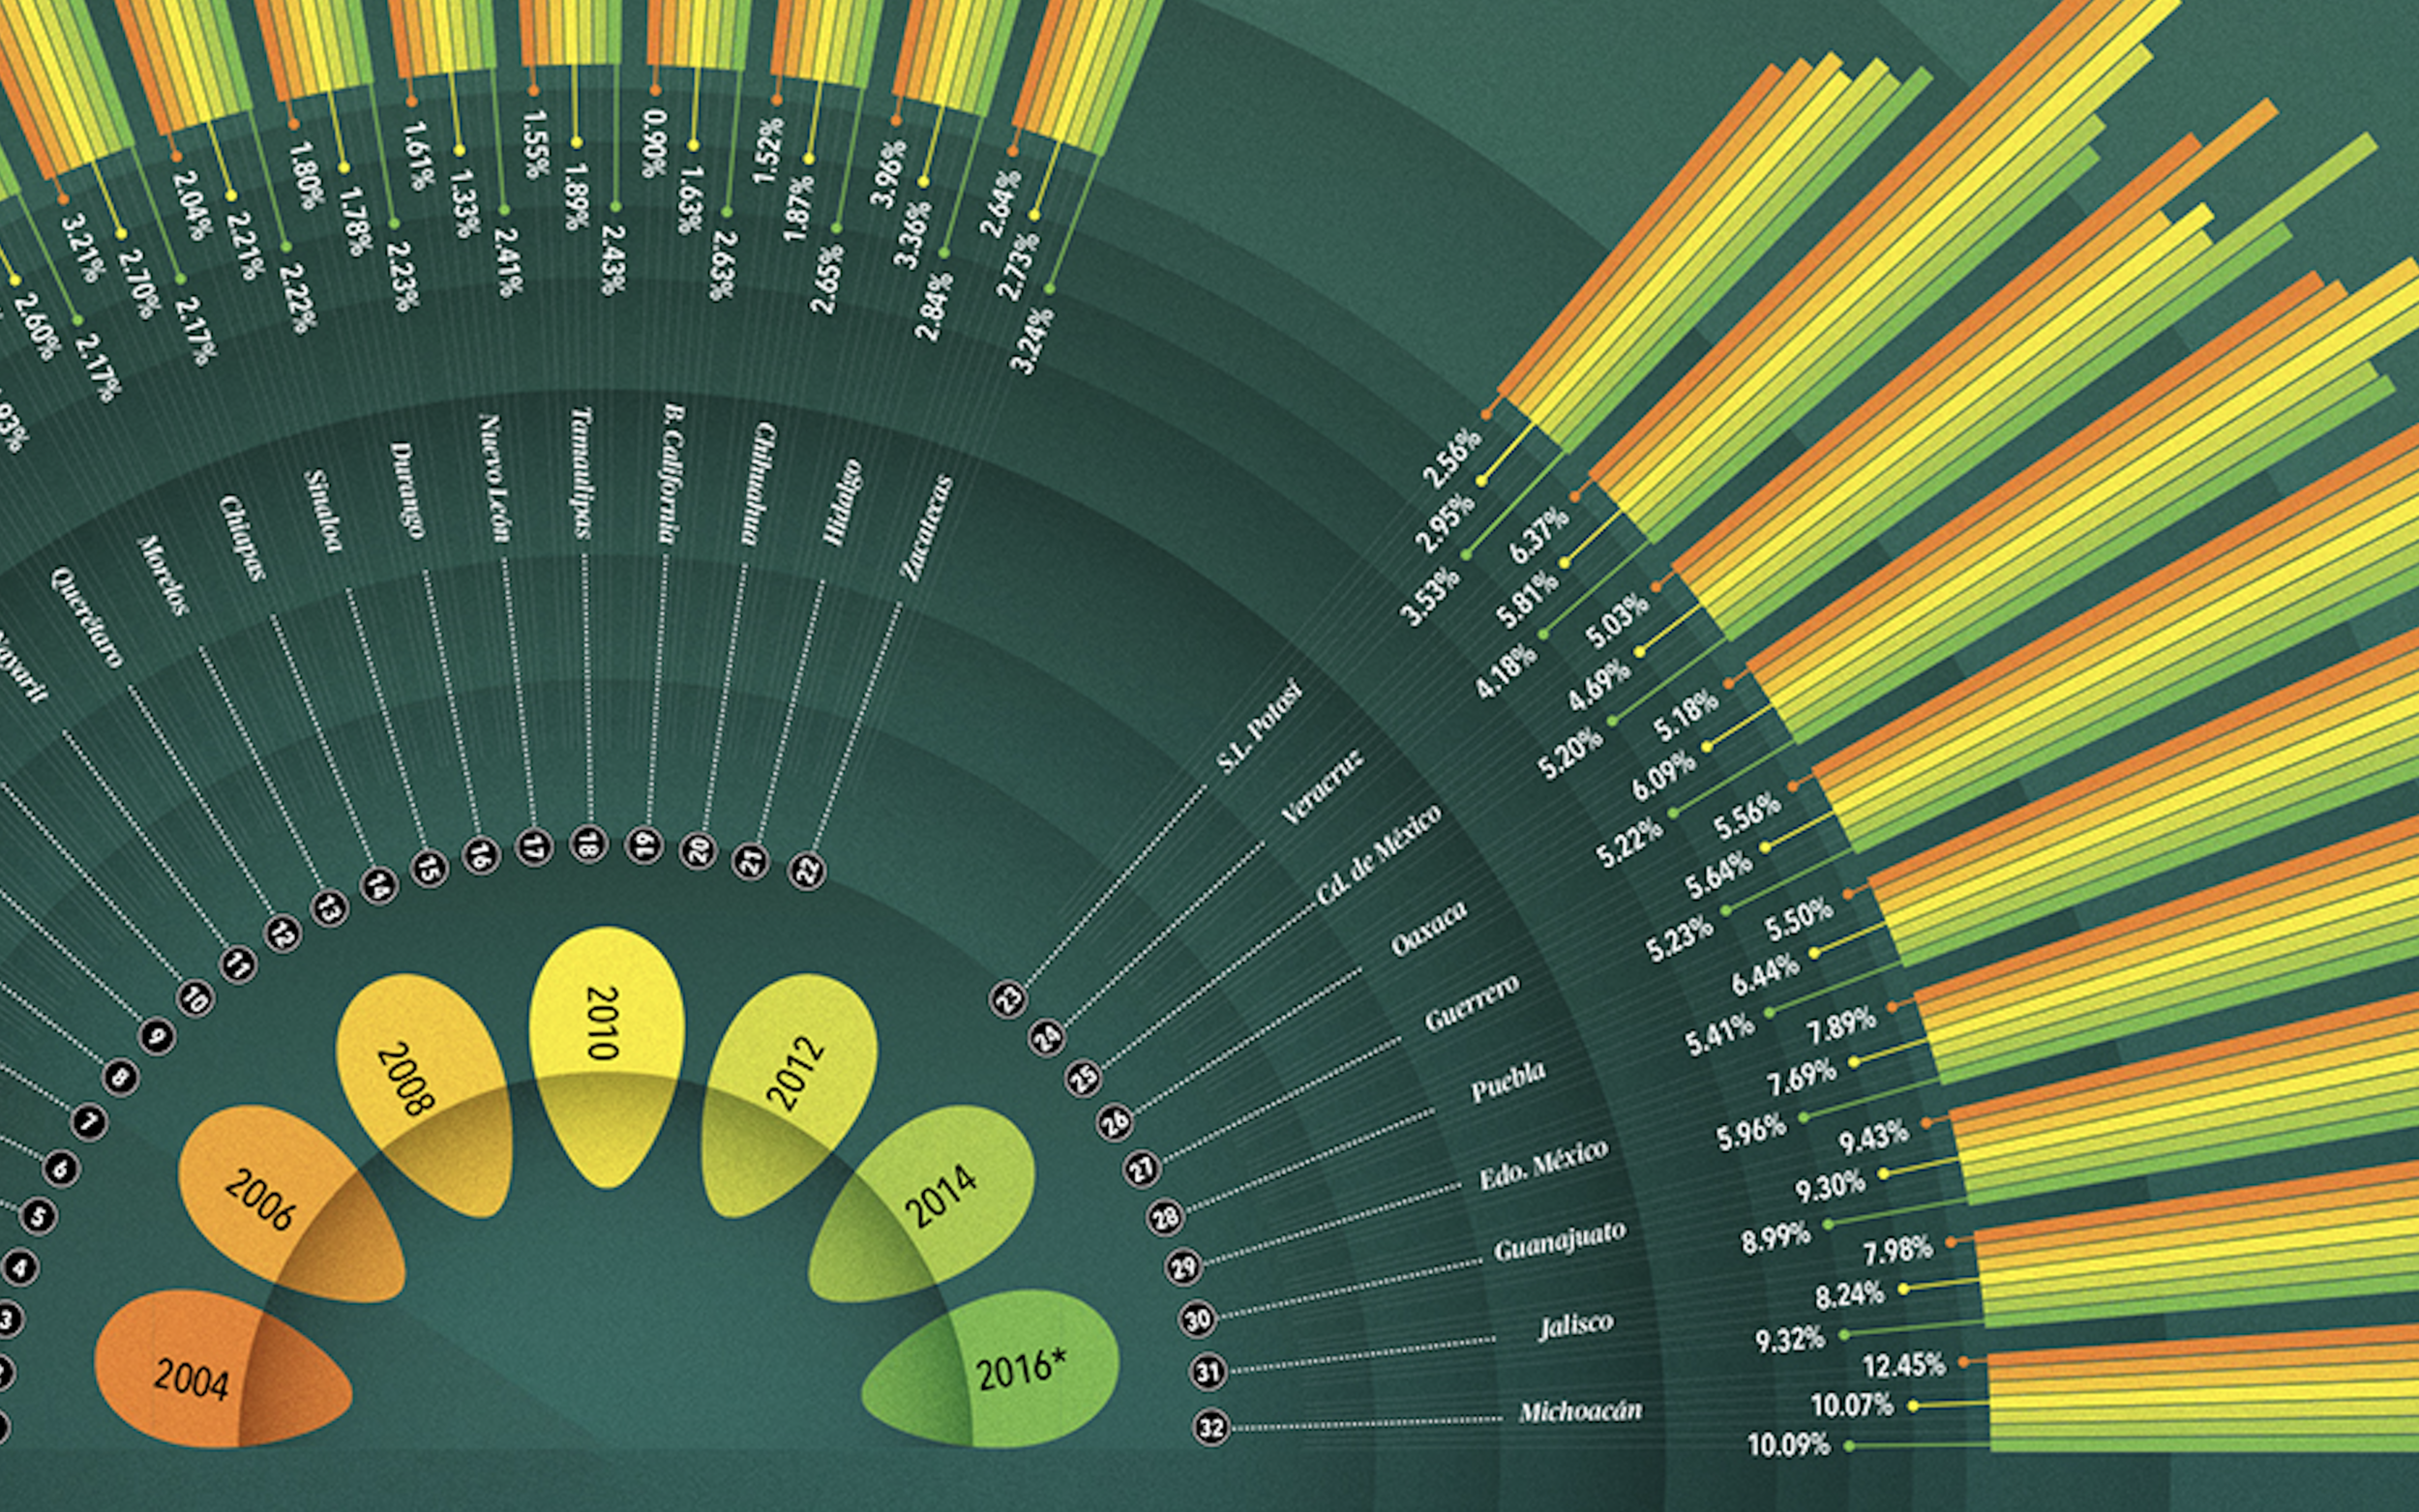
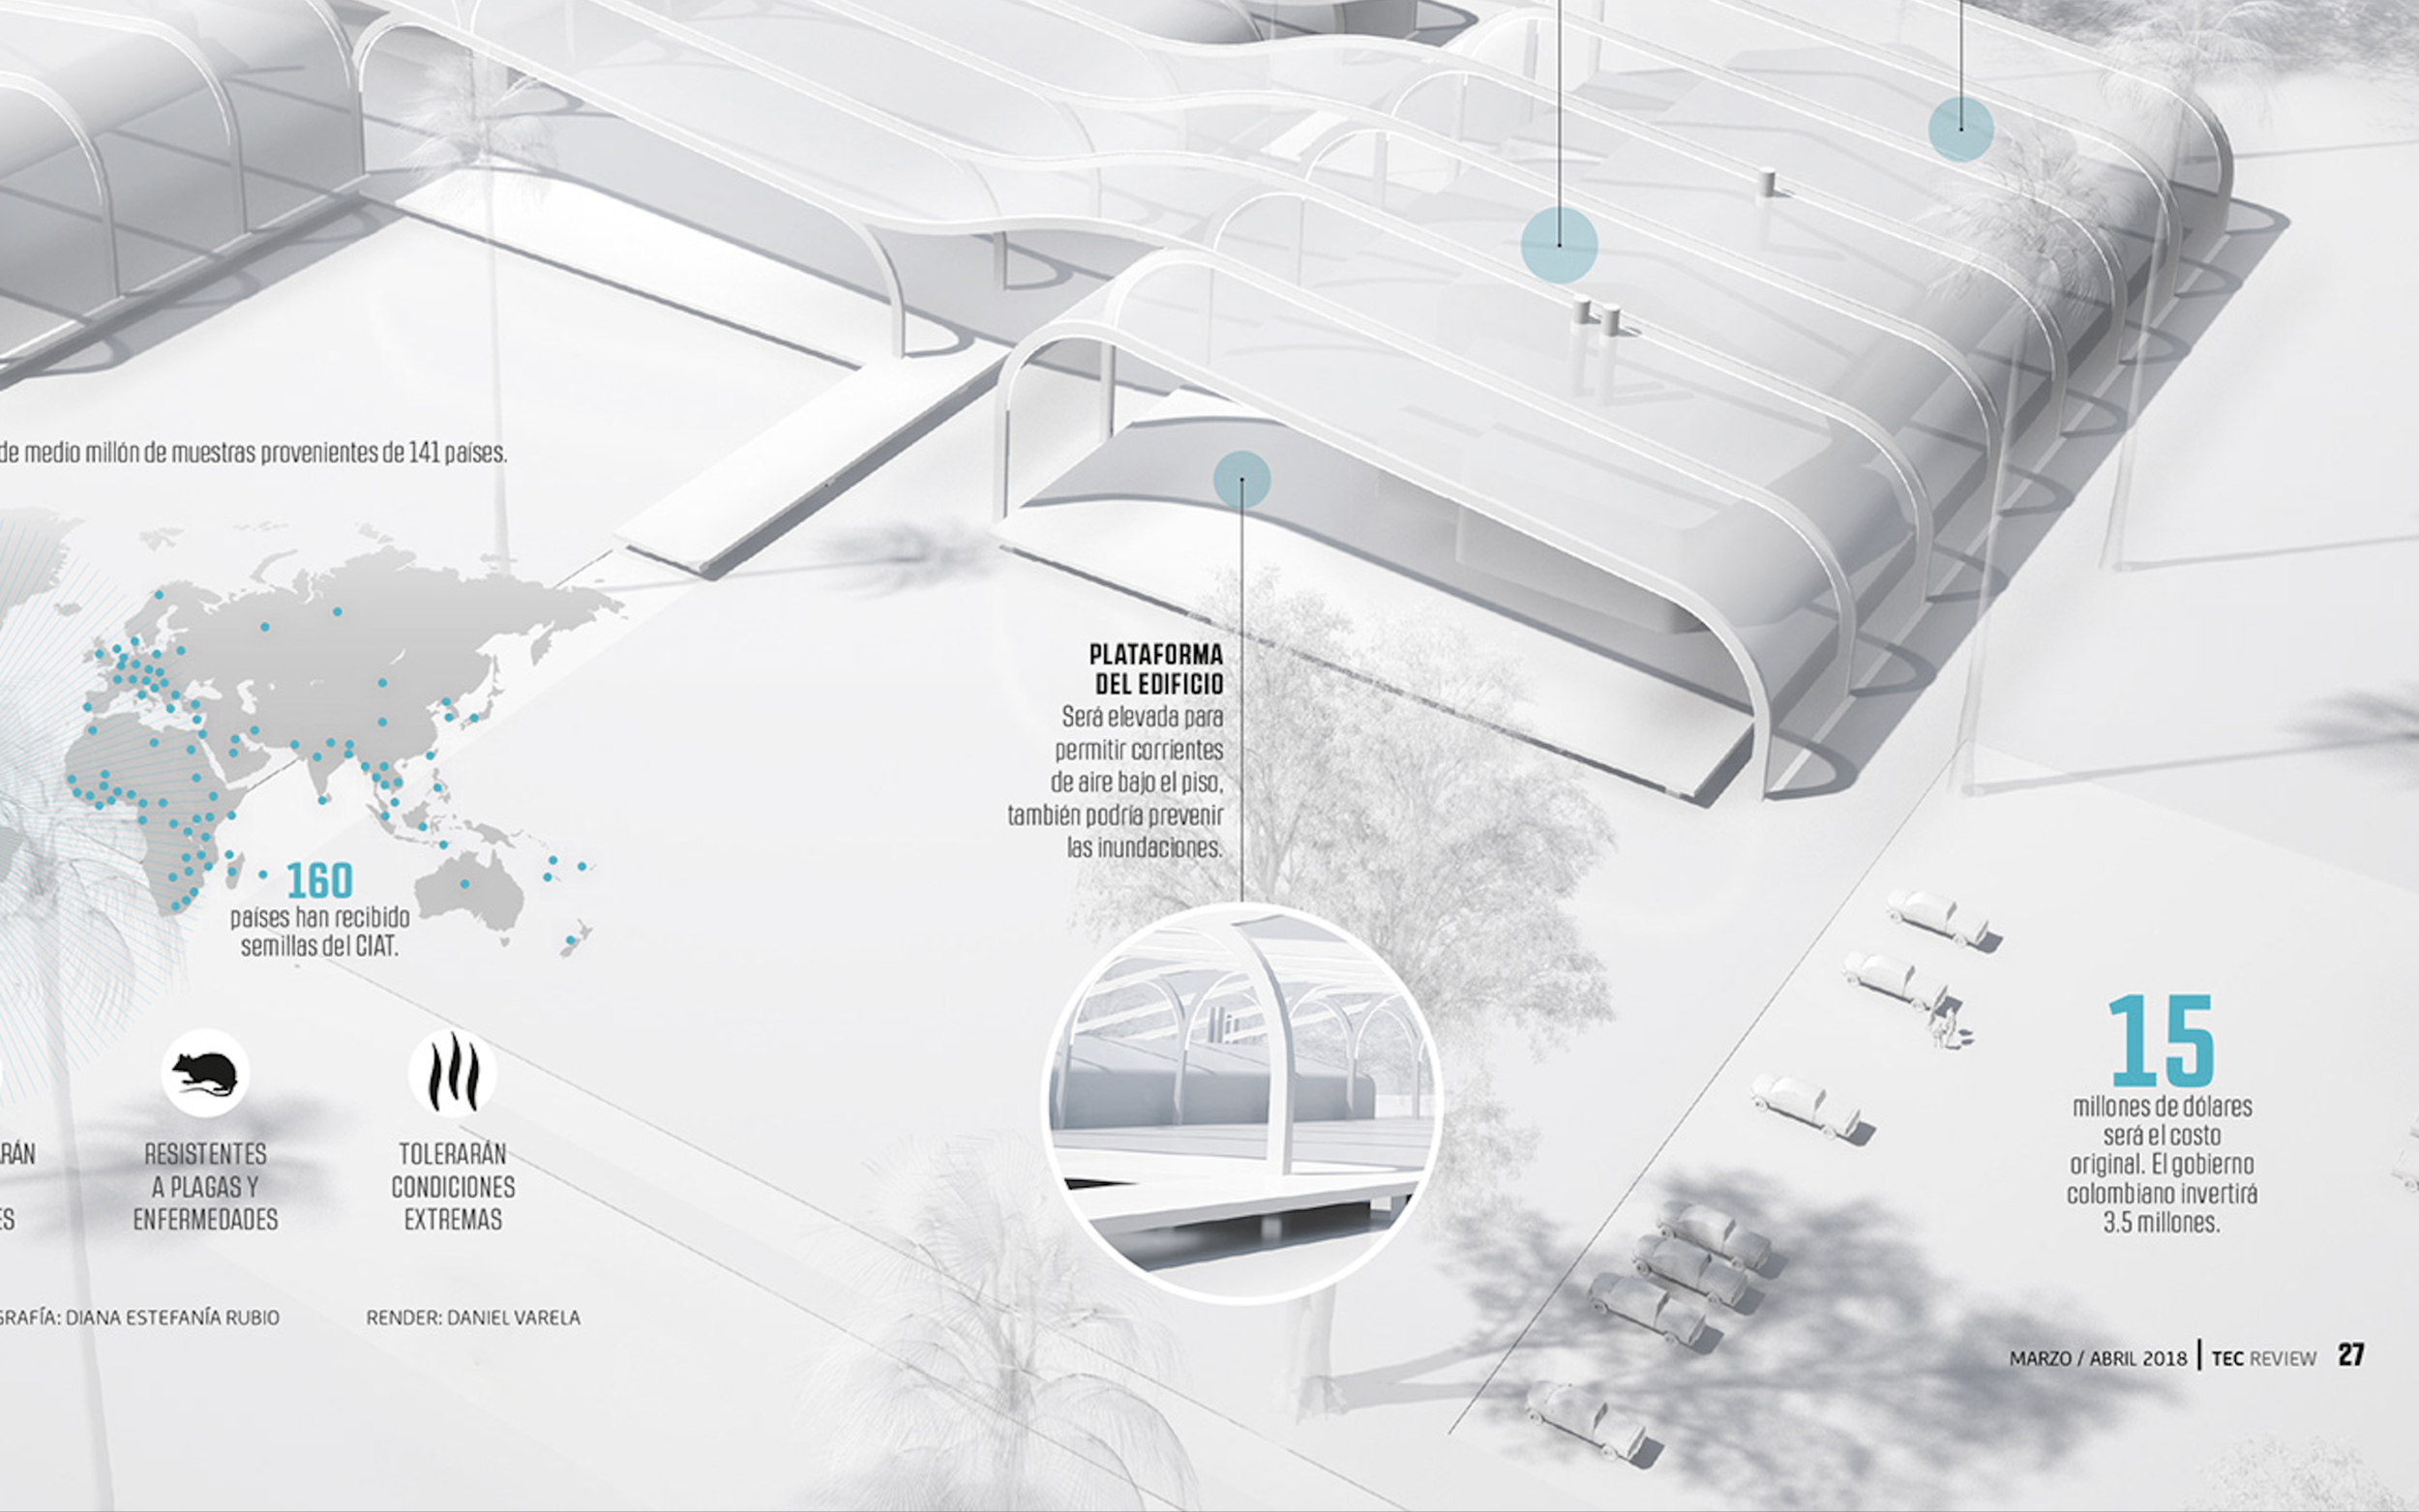
COURSE
Data Visualization for Editorial Projects
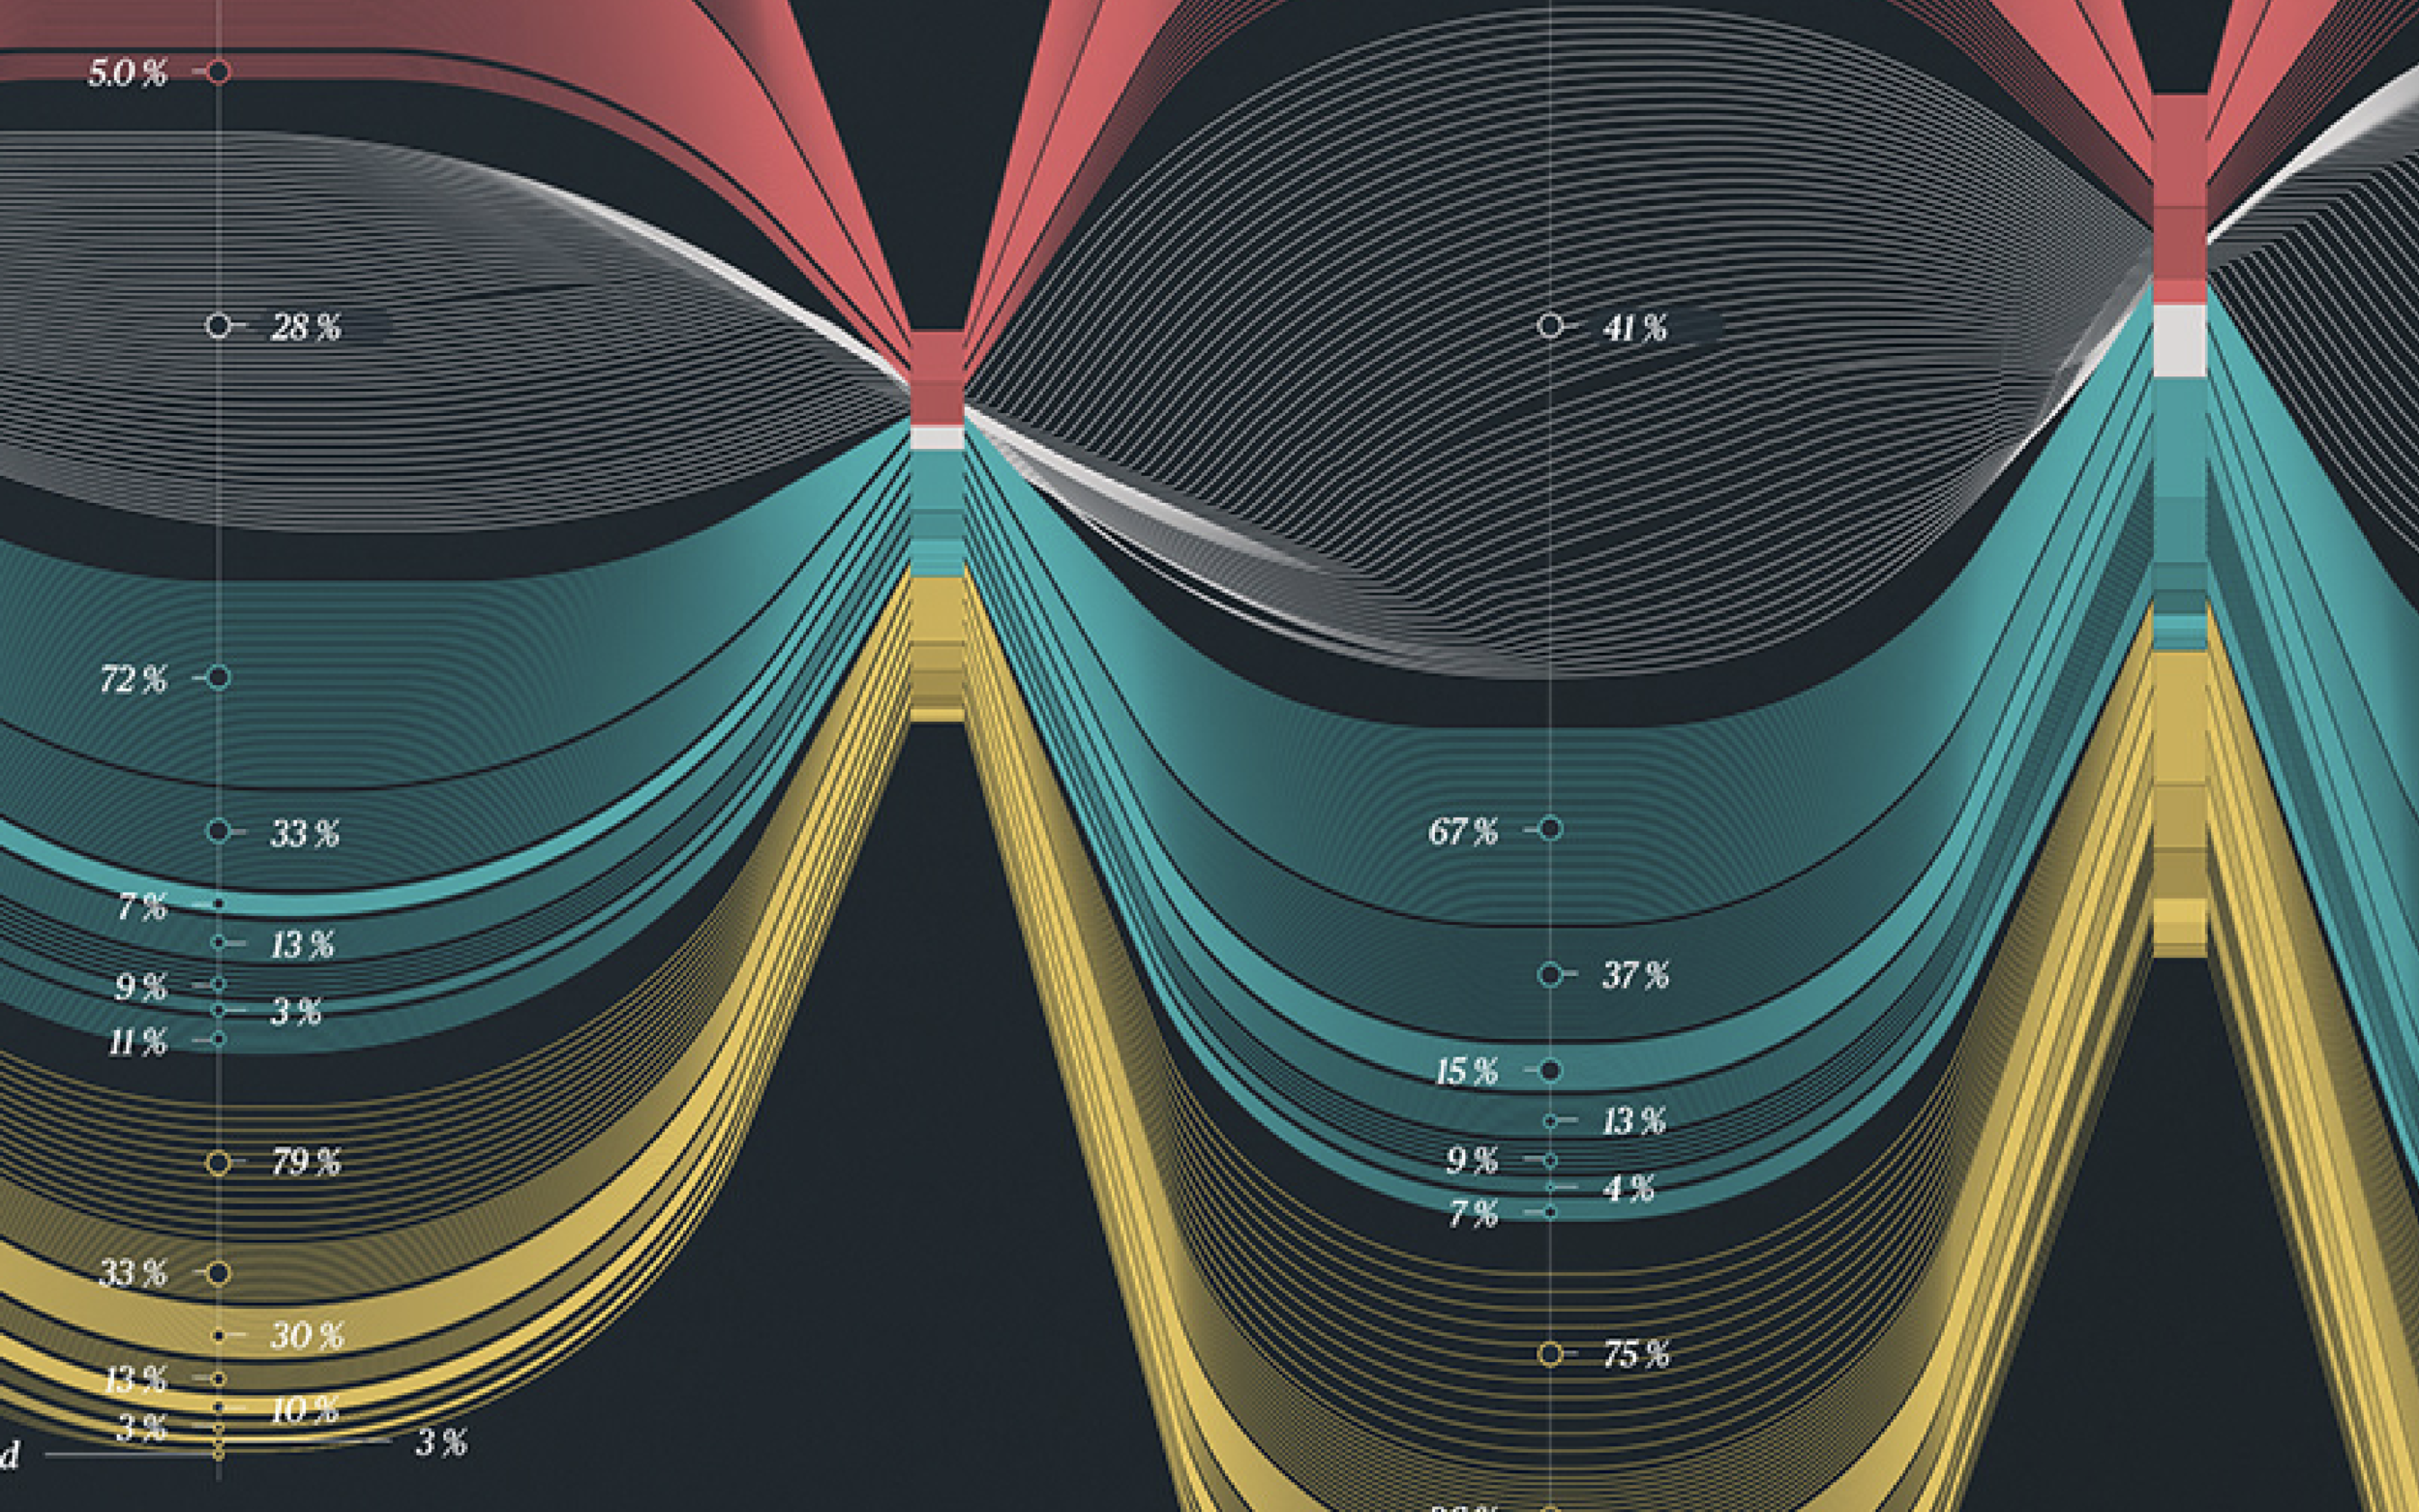
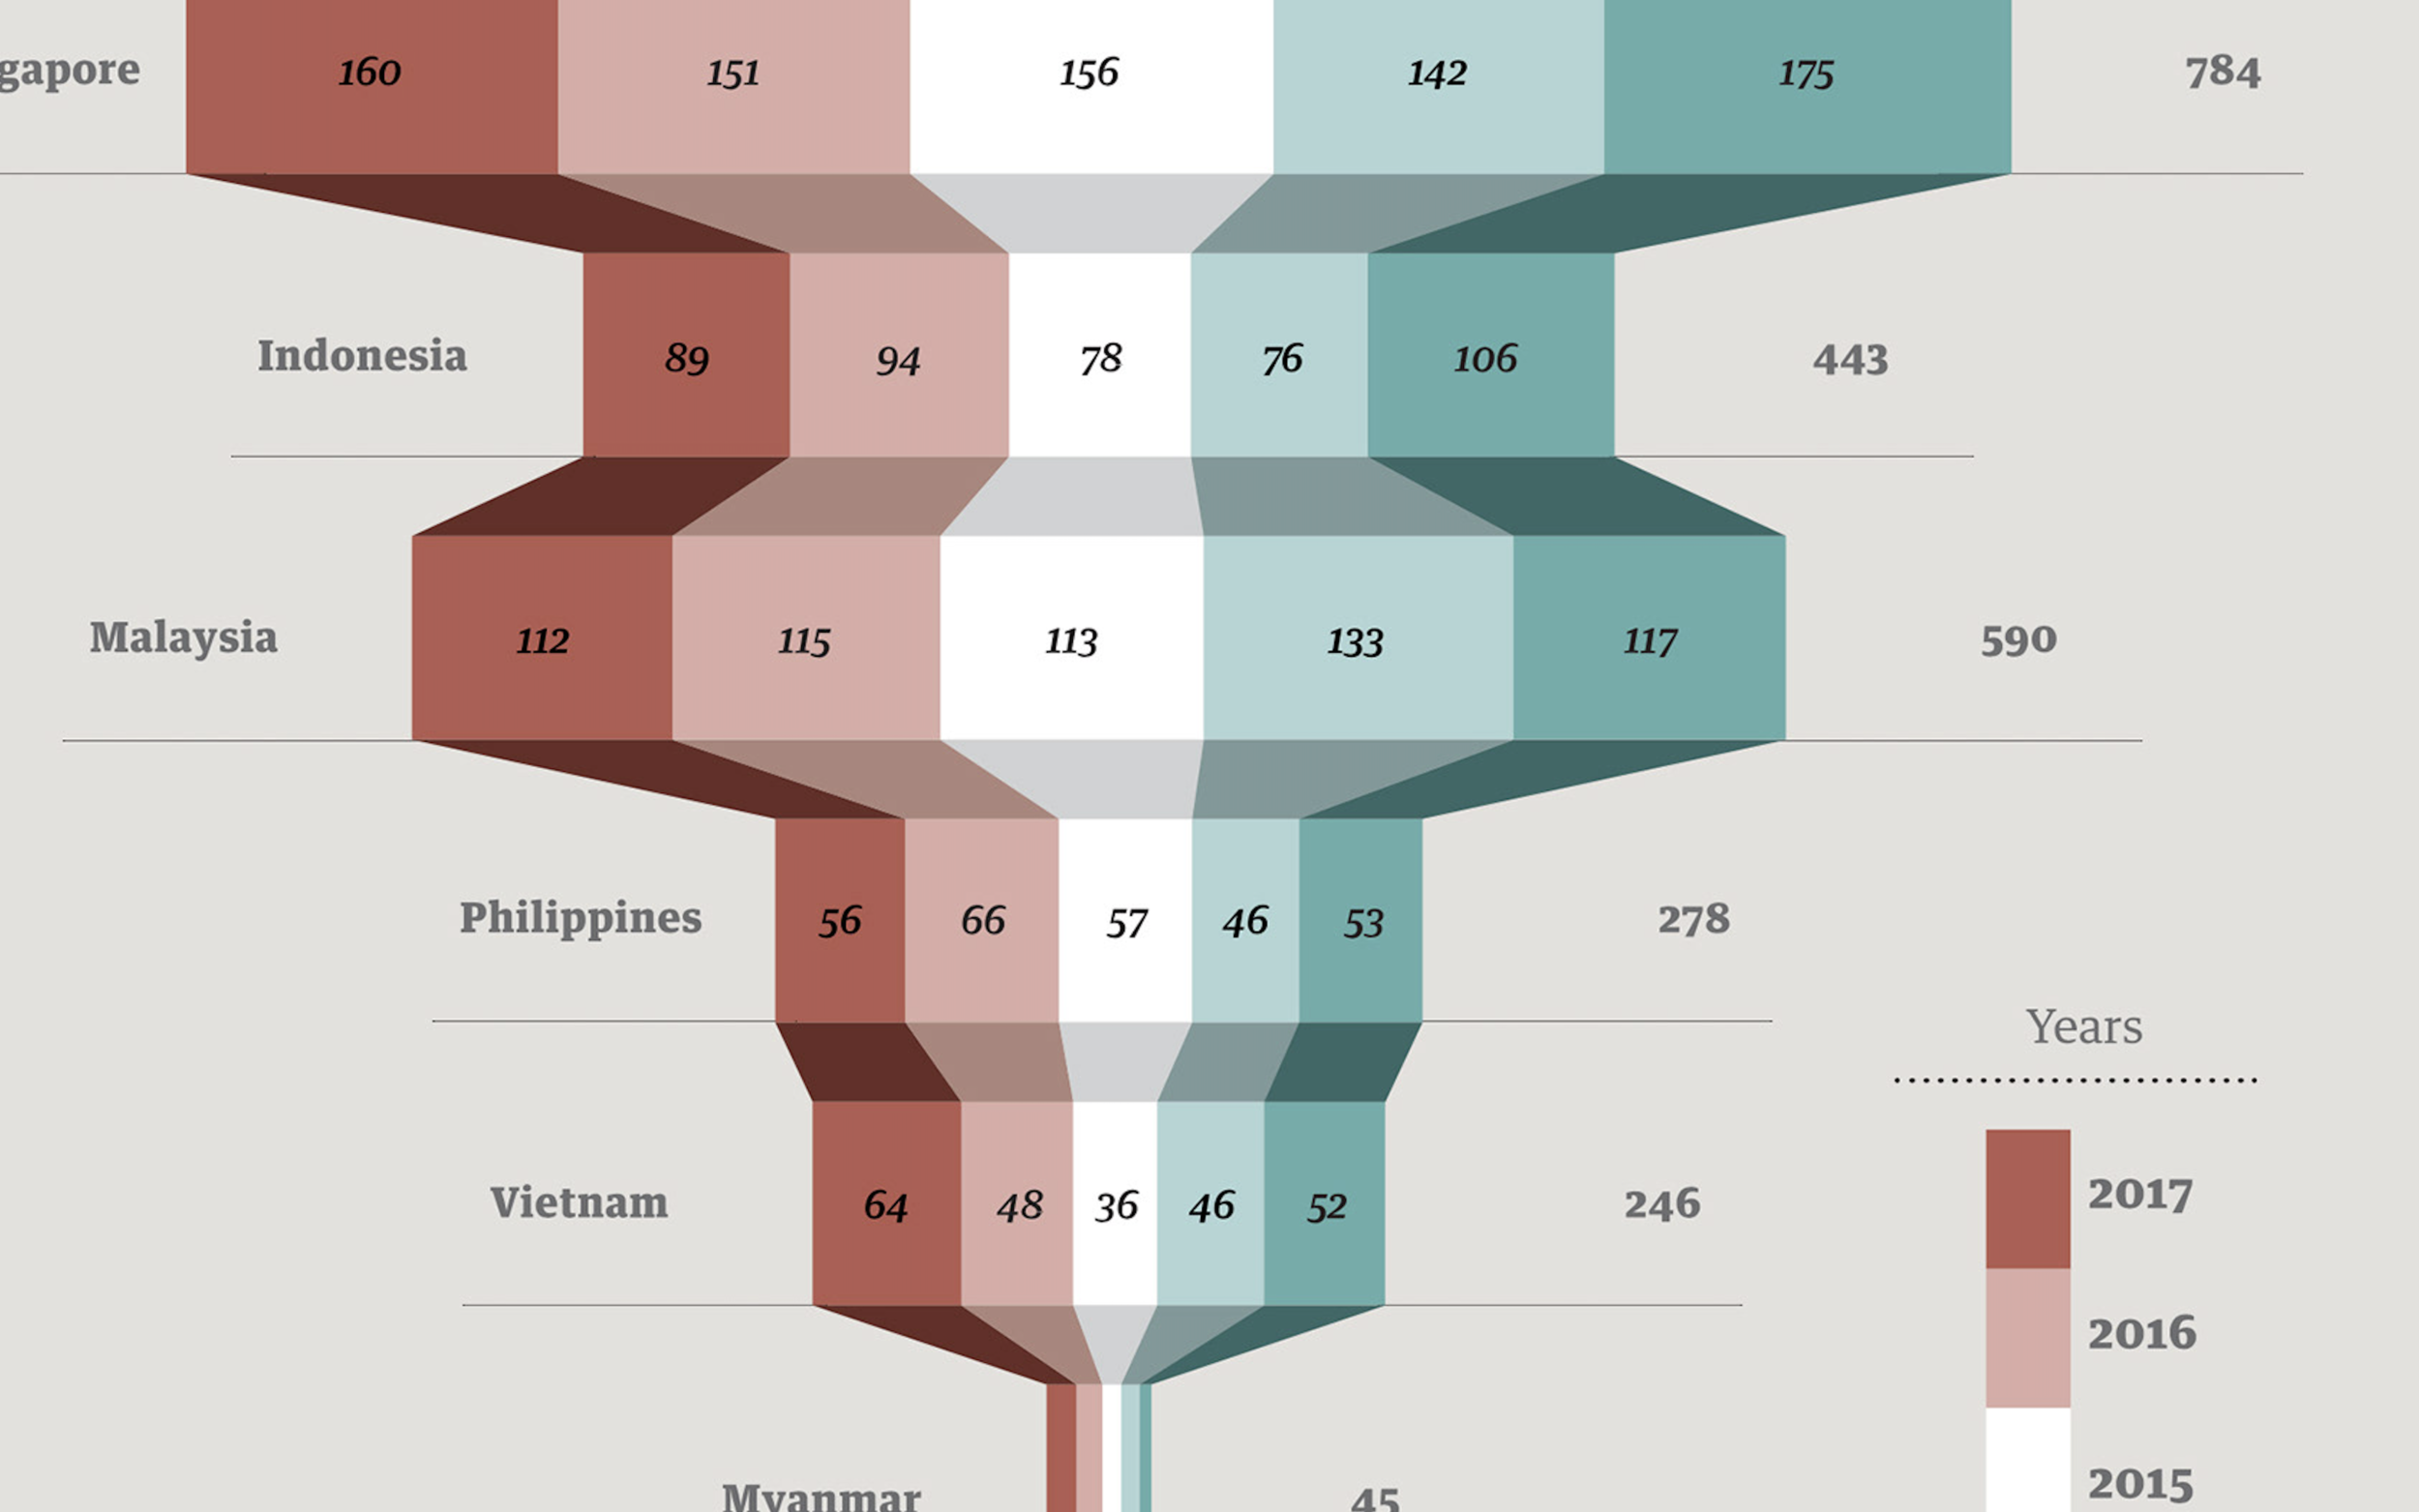
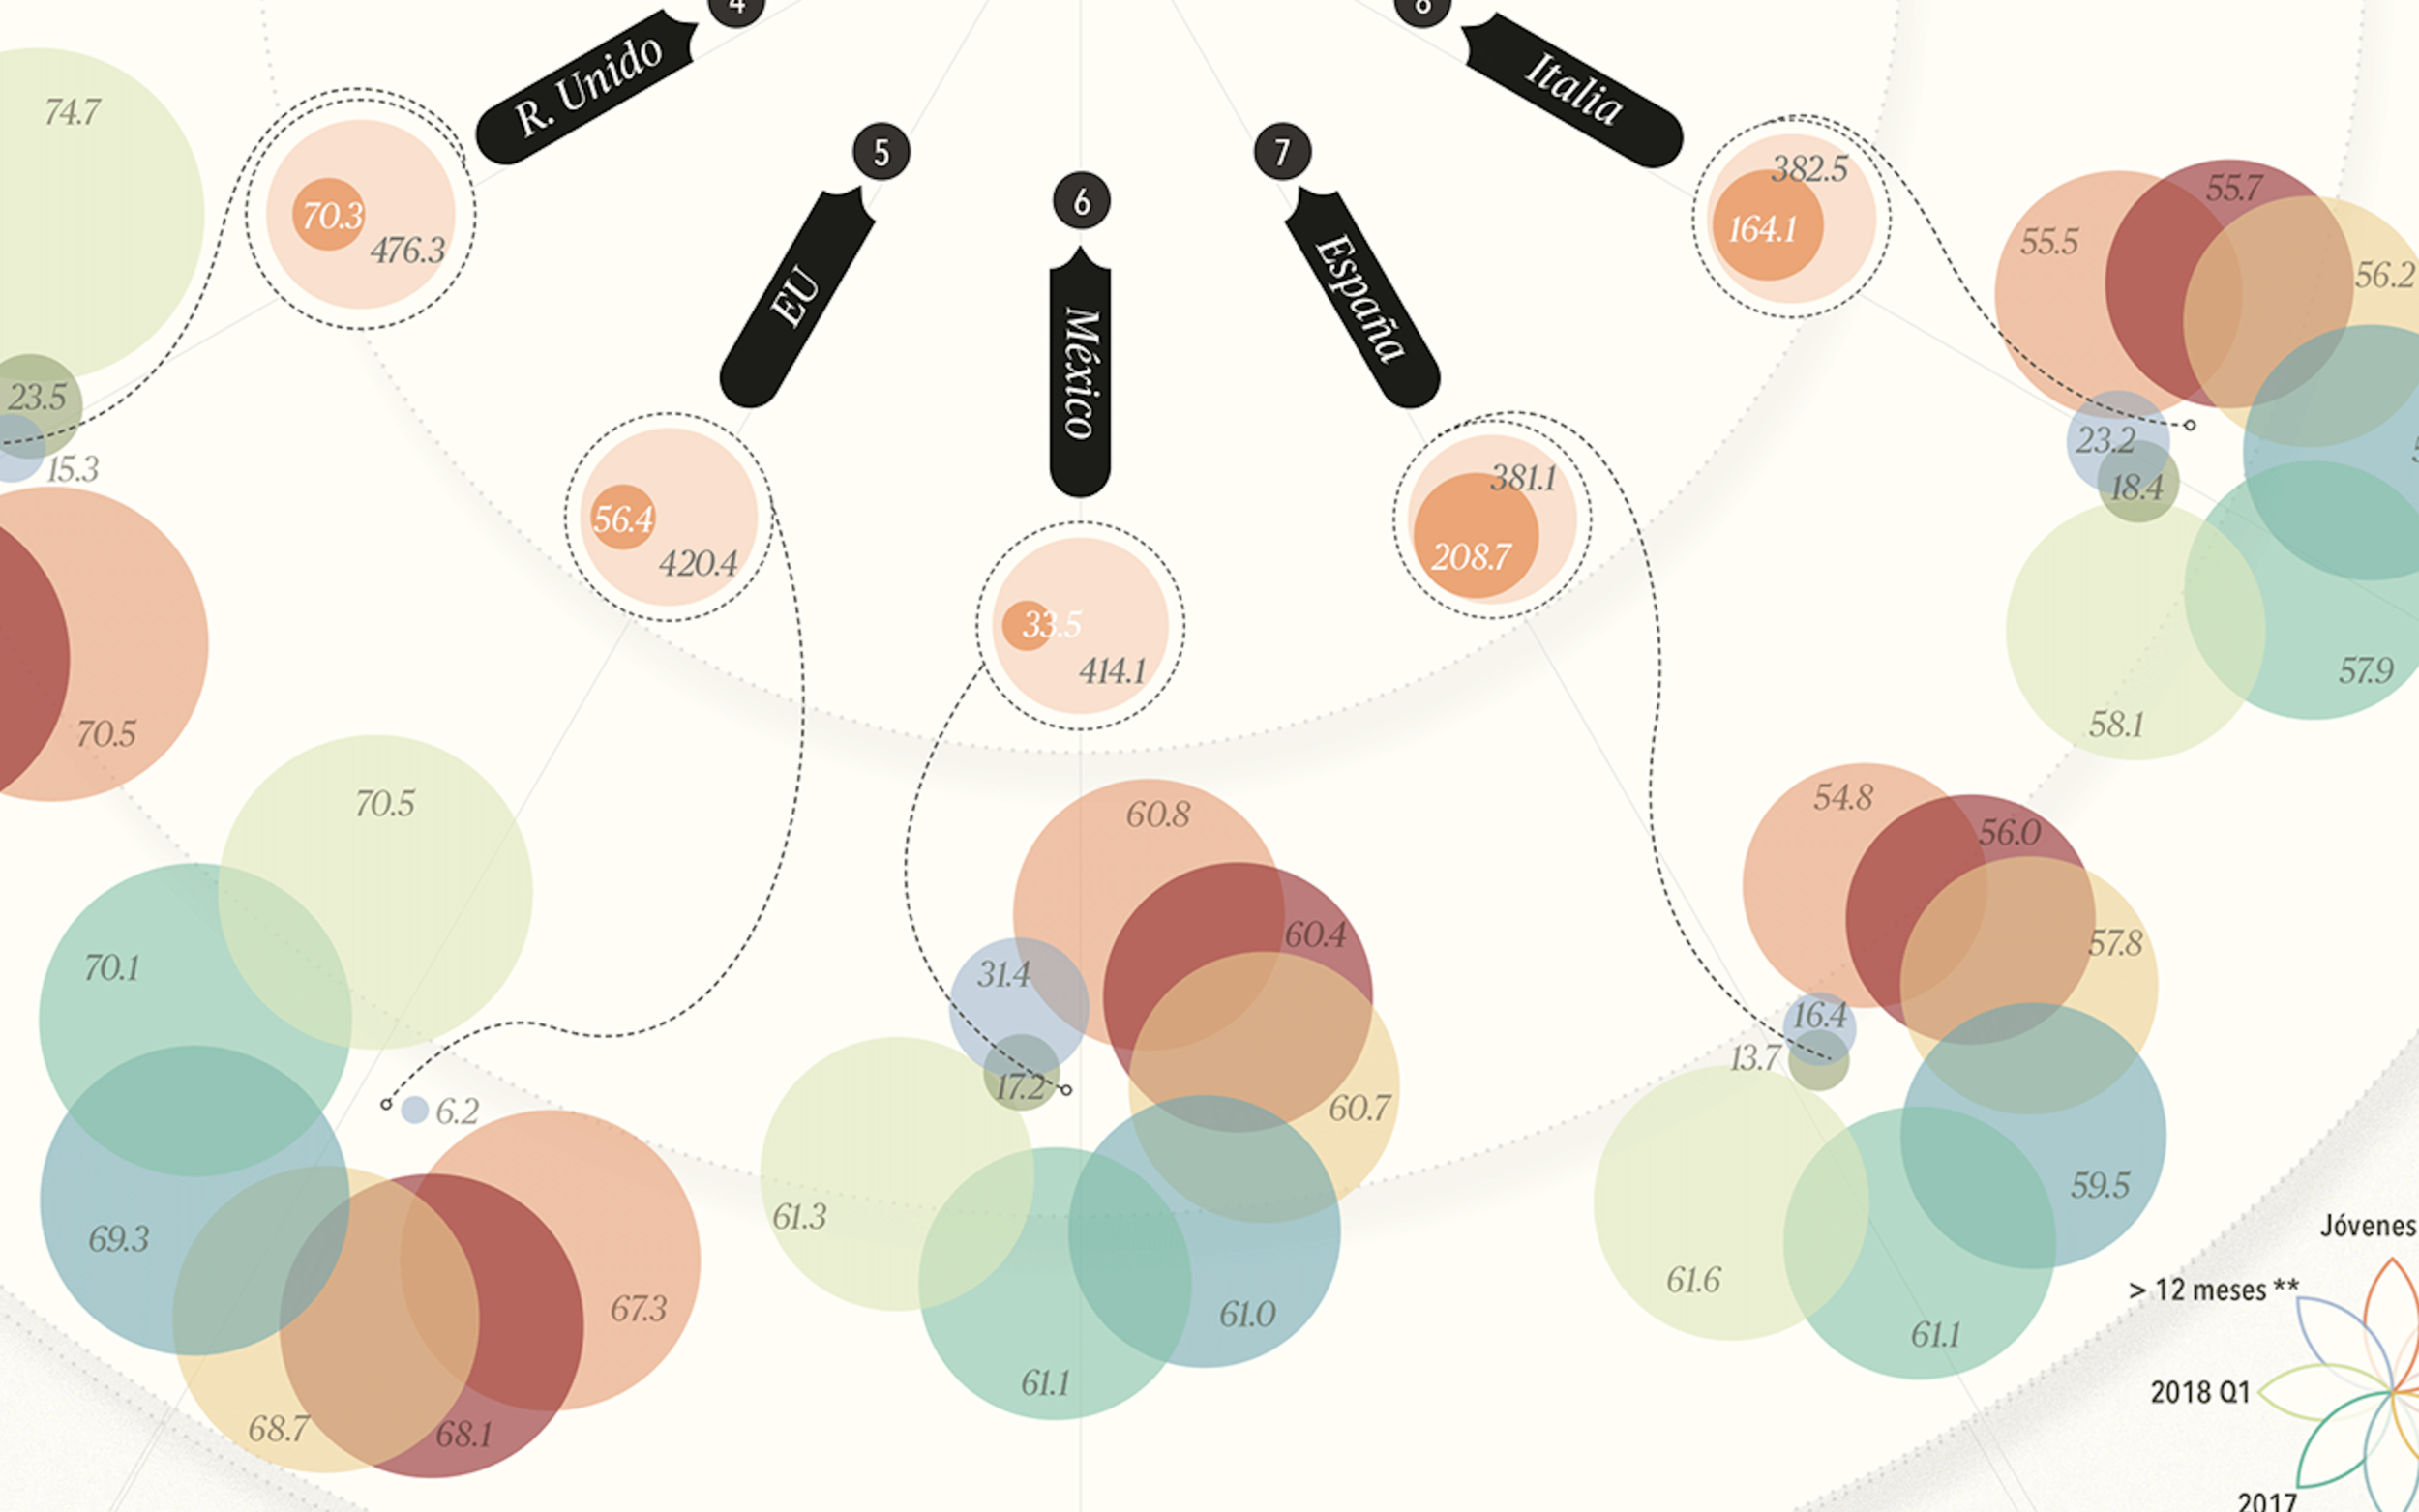
Learn to interpret, create and transform data into an attractive graph capable of communicating your message Only by understanding the information behind the data can you make sense of your designs. That is why, according to data visualization designer Diana Estefanía Rubio, the designer's job is to understand and interpret the numbers to help them convey their message in the form of attractive graphics. In this course, you will learn how to transform your data into powerful designs that can speak for themselves. Thus, you will create step by step a data visualization for editorial output that you can also share on your social networks. Upon completion of this course, you will have all the tools to read, develop, and convert data into an eye-catching graph.
-
You will start by knowing the professional experience of your teacher, Diana Estefanía Rubio, in the visualization area and the path she has traveled. Also, he will tell you about his sources of inspiration, from designers to publications, and the content of the course.
Then, you will enter the subject by defining what data visualization is, what is its main objective and what are its main elements. In addition, you will see the visual tools that you will use to design and you will learn how to correctly interpret the numbers.
Next, you will begin to shape your final project by understanding your data and then being able to make a sketch of its representation. From there, you will move on to Illustrator, where you will discover the main graphics and other options that the software offers.
In the last unit, you will work on the details. You will experiment with the typography until you choose the most appropriate one, you will make color tests and Diana will teach you how to give the final touch to your visualization by adding textures with Photoshop. Finally, you will see the different outputs of your work.
-
You will create a data visualization for editorial output that you can share on your social networks.
-
To graphic designers, information designers, data analysts or marketers. In short, to anyone who is interested in learning to visualize their data in an attractive and different way.
-
To take this course, you must have prior knowledge of data visualization and basic notions in Adobe Illustrator.
As for materials, you will use a computer with various software installed: Microsoft Excel, to read our data, Adobe Illustrator, to create the visualization, optionally Adobe Indesign, to place the layout, and Adobe Photoshop, to give it the finishing touch.
Skills______
-
![]()
Art Direction
Conceptualization and graphic styles within the visual design, data visualization, editorial design and user interface.
-
![]()
Data Visualization
Simple charts or big visualization using a big library chart of quantitative and qualitative data for editorial and digital design
-
![]()
UI Design
Design of visual styles, creation of wireframes, mockups, and digital prototypes, additional style guides to development.
-
![]()
Editorial Design
Layout design, diagramming, conceptualization of visual ideas, DataViz, and coordination with the design team.
-
![]()
Professional Teaching
Experience in teaching classes in three generations from 2019 to the present, in the specialty of data visualization, in Centro.


