
About me


¡Hola! I’m Diana
I'm an information designer based in Mexico City. I help newsrooms, institutions and companies turn complex data into visual stories people actually understand.
For 16+ years I've worked between newsrooms, consultancies and product teams: Grupo Expansión, DATALABMX, Afiniti, propelland, and since 2022 as lead information designer for Al Majalla in London, where I design the data graphics for its English and Arabic print and digital editions.
What holds it together is a conviction that a chart is an argument. It has to be accurate before it is beautiful, and clear before it is clever — whether it runs across a magazine spread or inside a dashboard someone opens every morning.
-
2022-2023
Elisava Facultat de Disseny i Enginyeria in Barcelona, Spain. ______ With the final project of the master:
“From Data Visualization to Data Humanism: Exploration and visualization of the 5 basic emotions in 8 areas of well-being”
-
CENTRO diseño | cine | televisión
-
in Universidad del Valle de México
Recognition & Awards

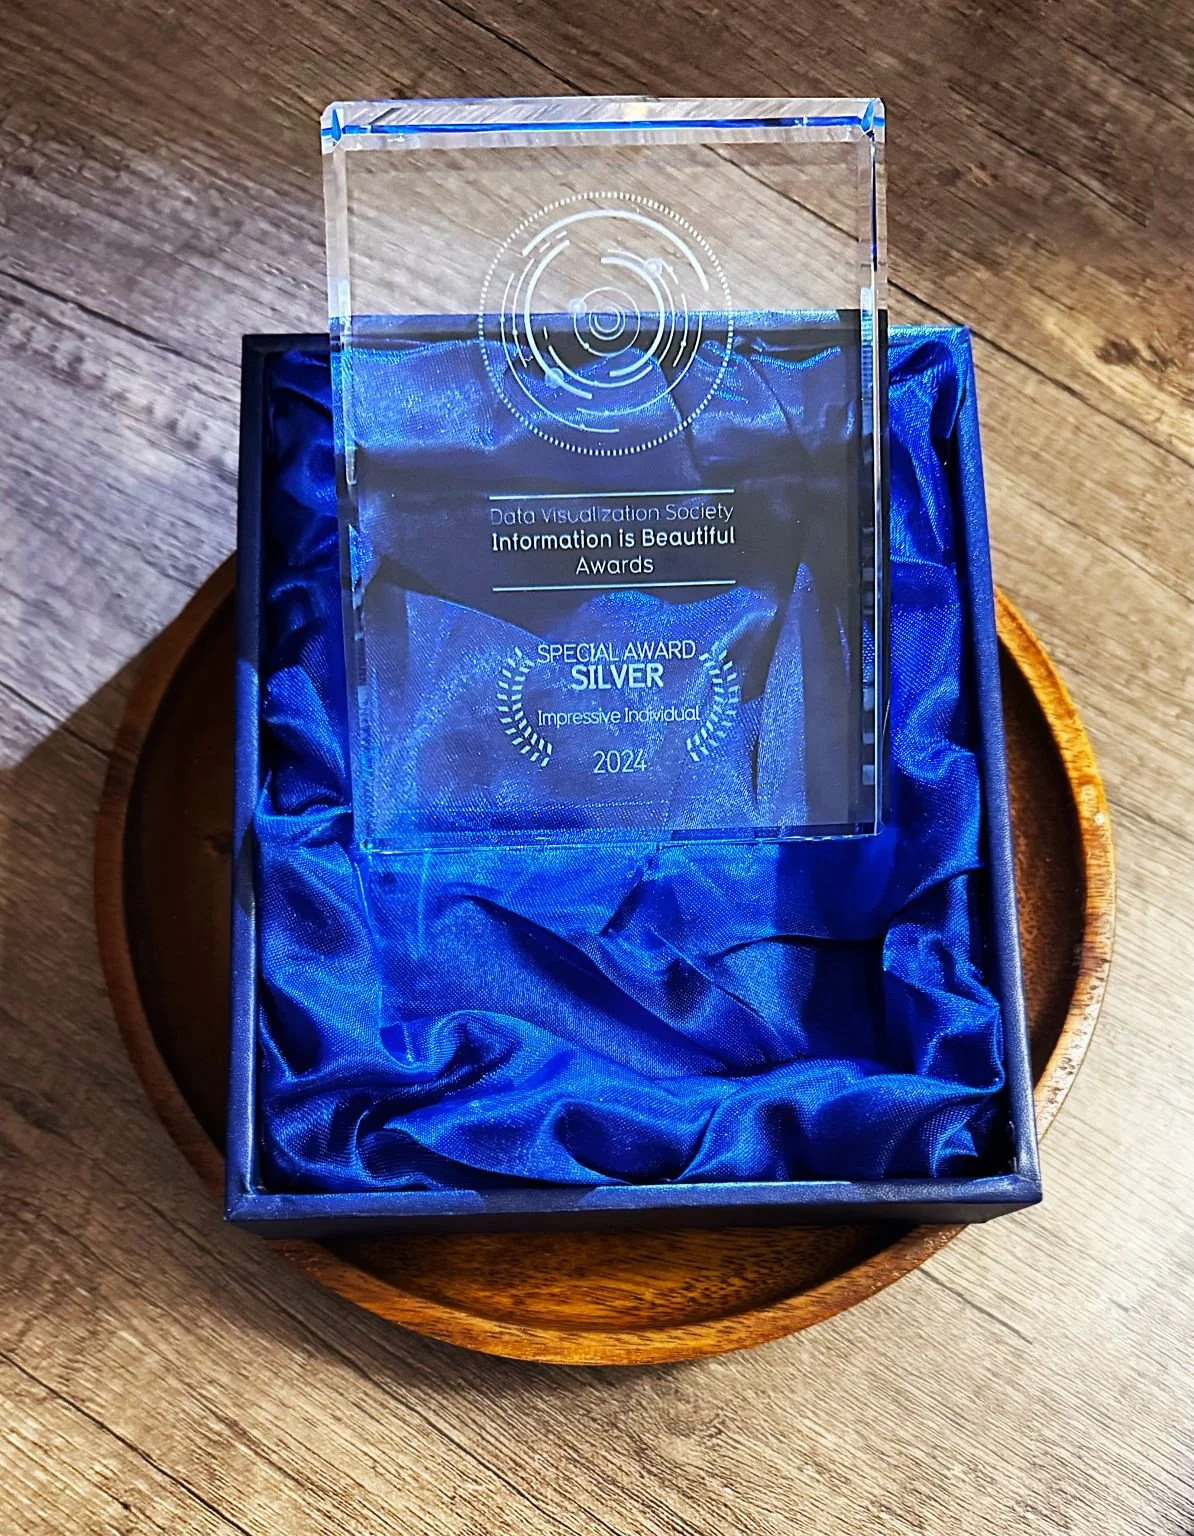
Silver Award, Impressive Individual — Information is Beautiful Awards & Data Visuaization Society 2025
Bronze Medal & 12 Awards of Excellence with Almajalla Team — Society Newspaper Designer 46 2026
Medal finalist — Society of Publication Designers #61 with “80 years Hiroshima from Ashes to peace” 2026
Merit Winner; Digital, Information Graphics Society of Publication Designers #61 with “Drug Trade in Latin America and the Caribbean”, Illustration, Information Graphics, “Trump’s Liberation Day” 2026
Long List, 2 projects — World Illustration Awards 2025
6 Awards of Excellence with Almajalla Team — Society Newspaper Designer 45 2025
Scholarship of Máster Universitario en Diseño y Comunicación — Expedido por Elisava · sept. de 2022 2022
Scholarship Domestika 2018 — Expedido por Domestika.org · ene. de 2019 2018
2 Awards of Excellence with Almajalla Team — Society Newspaper Designer 36 2014
Clients & Collaborators

Expertise
Data visualization & information design
Editorial infographics (print & digital)
Dashboards, UI & data products
Design systems & chart libraries
Art direction
English · Spanish · projects in Arabic
-
El Sabor de la Data: Análisis y visualización de datos | Xdata Mexico, 2022
Visualização Artesanal | DatavizRio, Brazil 2022.
Inspirada na icônica imagem-manifesto "América Invertida", do uruguaio Joaquín Torres Garcia, a 18ª edição do DatavizRio trouxe como tema "Visualização de dados fora do eixo: dataviz feito na e pela América Latina". E a mexicana Diana Estefanía Rubio foi nossa convidada especial deste encontro. Ela, que é designer de informação com mais de 10 anos de experiência profissional em projetos editoriais e digitais, conta sobre sua trajetória e compartilha conosco seu método para criação de visualizações de dados.Mi Vida en Datos by Diana Estefanía Rubio | Infovis, Mexico, 2022
Visualización y Datos online Conference | iGEM Ollin Synbio, Mexico 2022
Interview , winners of the Domêstika Scholarship 2018, Domestika 2021
Conference for the specialty of Infographics and data visualization | Pontificia Universidad Católica de Chile, Chile 2020
-
Glamorous Infographics, Information Visualization Design, Designer Books 2024
Information Made Beautiful II - Infographic Design, 2019
Visual Storytelling Infographic Design In News - Descripción de la publicaciónImage Publishing Edition China 2015
Visual Storytelling Infographic Design In News - Descripción de la publicaciónImage Publishing Edition France 2016
-
Domestika Interview 2021, winner of the Domestika Scholarships 2018
Interview for Infovis 2018 - International congress of visual communication, 2018
